

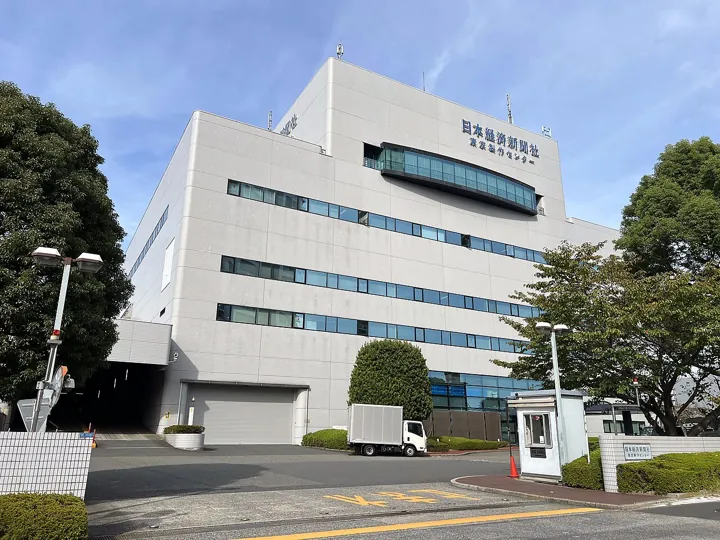
- Description
- A newspaper printing plant
- Source
- Asanagi · original page
- Licence
- CC0 Public domain
 Maturity Matrix — Development of a BI Tool / Application
This matrix measures the maturity of a team that builds and maintains a BI product: semantic model, DAX calculations, data layer, reporting, security, industrialization…
In brief
- This matrix measures the maturity of a team that builds and maintains a BI product: semantic model, DAX calculations, data layer, reporting, security, industrialization, operations.
- It includes 12 themes and 5 levels per theme. Each level describes an observable outcome (the promise), verified by specific milestones.
- It differs from the data project matrix (data lifecycle as an asset) and the software development matrix (generic engineering): here, we assess the BI product itself.
- It is used for self-assessment (see self-assessment) or as a team roadmap.
Level: 🟢→🔴 · Matrix code: BI
Domain promise#
A mature BI product tells the truth, quickly, to the right person, in their language, and is delivered without fear.
In concrete terms, a level-5 team across the whole matrix delivers reports where: (1) numbers are reconciled with the source and tests prove it in every release; (2) response time stays under one or two seconds in real use; (3) each user sees only what they are authorized to see; (4) code (model, measures, queries) is versioned, reviewed, and deployed via pipeline; (5) the platform is monitored and its cost is controlled; (6) the report is accessible and multilingual without forking. Few teams achieve this everywhere; level 5 is a compass, not an entitlement (RATING).
Audience and usage#
- BI / datamart developers: position their practices and identify the next worthwhile milestone.
- Team leads, architects: arbitrate investments (tests, pipelines, capacity) using shared reference points.
- Juniors: understand what “doing it well” means, theme by theme, with verifiable milestones.
- Typical usage: a 2-hour session per quarter, each person rates milestones (0 / 0.5 / 1) with evidence, compare results, select 2 to 3 milestones to conquer.
Illustrative thread (anonymous): an SQL Server datamart fed by a field sales force automation (SFA) application, with multilingual Power BI reports, versioned in TFVC, delivered in installation kits. See also the Power BI Reporting section.
Scope#
| In scope | Out of scope (reference) |
|---|---|
| Semantic model (star schema, relationships, hierarchies), DAX, Power Query/M | Upstream dimensional modeling of the SQL datamart: PD — modeling |
| Report formatting (visuals, navigation, UX) | Project management, ceremonies: PI matrix |
| RLS/OLS, model and report access rights | Overall regulatory compliance: PD — security and compliance |
| PBIP/TMDL versioning, deployment pipelines, measure testing | General CI/CD principles: DL — Continuous Integration and Continuous Delivery |
| Capacity monitoring, costs, licensing | Enterprise data governance (global catalog): PD — governance |
We assess the substance (practices, artifacts, evidence), not the actual ergonomics of an interface.
The 12 themes and their codes#
| No. | Code | Theme | In one sentence |
|---|---|---|---|
| 01 | MOD | Semantic Model | Star schema, relationships, cardinalities, filter direction, role of dimensions and calendar table. |
| 02 | ETL | Data Layer and ETL | Model ingestion: source views, Power Query, folding, dataflows, column contracts. |
| 03 | PRF | Performance and Data Volume | Cardinality, aggregations, storage modes, response and refresh times. |
| 04 | VIZ | Visualization and UX | Visual choices, navigation, readability, cognitive load, theme consistency. |
| 05 | DAX | DAX Measures and Calculations | Measures over columns, context, time intelligence, calculation groups, conventions. |
| 06 | RLS | RLS Security and Access | Static/dynamic RLS, OLS, sharing, role testing. |
| 07 | IND | Versioning and Industrialization of Reports | PBIP/TMDL, Git/TFVC, deployment pipelines, environments. |
| 08 | TST | Testing and Reliability of Numbers | DAX test queries, reconciliation, BPA, regression prevention. |
| 09 | GOV | Governance, Catalog, and Self-Service | Certified models, endorsement, workspaces, governed self-service. |
| 10 | OPS | Operations, Monitoring, and Capacity | Refreshes, alerts, Capacity Metrics, logs, support. |
| 11 | ACC | Accessibility and Multilingual | Contrast, keyboard navigation, alt text, translations, regional formats. |
| 12 | CST | Cost, Licensing, and Capacity | Pro, PPU, Premium capacities (P-SKU, being retired), F-SKU: sizing, cost per usage, optimization. |
Summary table themes × levels#
| Theme | N1 | N2 | N3 | N4 | N5 |
|---|---|---|---|---|---|
| MOD | Flat tables, automatic relationships | Readable star schema, controlled relationships | Documented strict star schema, dedicated calendar | Contract-based model, dimension roles mastered | Composable model, scalable without breaking reports |
| ETL | Copy-pasted queries | Source SQL views, simple M | Verified folding, parameters | Column contracts, idempotent replay | Tooled, self-healing incremental ingestion |
| PRF | “It’s slow” endured | Time measured, initial tuning | Cardinality and aggregations managed | Performance budgets in pipeline | Sub-second at nominal load, proven |
| VIZ | Default visuals | Shared template | User flow and visual hierarchy | Design system, usability tests | Adaptive experience, continuously measured |
| DAX | Calculated columns, copy-paste | Named measures | Time intelligence, VAR, conventions | Calculation groups, reused base measures | Tested and versioned measure library |
| RLS | Open sharing | Static roles | Dynamic via security table | Tested roles, OLS, logged | Proven security, continuous auditing |
| IND | .pbix file on a shared drive | .pbix in repository | PBIP/TMDL in Git or TFVC | Dev-test-prod pipeline, PR review | Continuous deployment, rollback in minutes |
| TST | Visual check | Documented manual checks | Replayable DAX test queries | Pipeline tests + BPA | Automatic regression prevention, alert thresholds |
| GOV | Orphan reports | Owners identified | Certified models, structured workspaces | Living catalog, lifecycle | Safe, measured, self-regulated self-service |
| OPS | No monitoring | Failure alerts | Operations dashboard | SLO, monitored capacity, runbooks | Auto-scaling, incidents anticipated |
| ACC | Ignored | Contrast checked | Tab order, alt text | Tooled metadata translations | Accessible and multilingual report without fork |
| CST | Licensing endured | Cost known | Cost per usage tracked | Optimized sizing | Cost tied to value, continuous arbitration |
Rating rule#
Shared rule (identical across all matrices):
each milestone has progress 0 / 0.5 / 1. A level N is achieved if the average progress of all milestones from levels 1 to N is ≥ 0.8 and no milestone is at 0. Theme score = N_achieved + average progress of milestones at level N_achieved+1 × 0.99 (e.g., 2.4). Matrix score = weighted average of themes (default weight 1, adjustable). A whole score of 5.0 is exceptional and may never be reached: this is not a failure.
Identifier convention: BI-<THEME>-<level>.<n>, for example BI-DAX-3.2 (DAX theme, level 3, milestone 2). Each milestone comes with evidence (screenshot, query, file, commit): without evidence, progress cannot exceed 0.5.
Reading scores#
| Score | What this says (without moral judgment) |
|---|---|
| 0 – 1 | The product relies on individuals and local files; it works as long as its authors are present. |
| 1 – 2 | The basics exist (readable model, named measures) but nothing is reproducible or tested. |
| 2 – 3 | Team-wide practices, repeatable deliveries, initial controls; quality still depends on vigilance. |
| 3 – 4 | The product is being industrialized: versioned code, replayable tests, monitoring; incidents are rare and understood. |
| 4 – 5 | Guarantees are automated and measured; the team improves the system more than it repairs it. |
A highly uneven score (a 4 in DAX, a 1 in testing) is more useful information than the average.
Entry points and dependencies#
Where to start: MOD (everything relies on it), then DAX and TST. A flawed model or an unchecked number destroys trust, no matter how beautiful the report is.
Main dependencies:
ETL ──► MOD ──► DAX ──► TST ──► IND ──► OPS
          │       │                │       │
          ├──► PRF ◄──┘            └──► GOV └──► CST
          └──► RLS      VIZ ──► ACC
- TST before IND: do not automate a deployment when you cannot verify its outcome.
- MOD before PRF and RLS: propagated cardinalities and filters determine speed and security.
- OPS before CST: you cannot optimize what you do not measure.
- GOV (certified models) reduces duplication, therefore the cost of PRF and CST.
Typical organizational profiles#
| Profile | Description | Plausible scores |
|---|---|---|
| File workshop | 1 to 2 people, .pbix shared by email, workbook imports. | MOD 1.3 · DAX 1.5 · TST 0.5 · IND 0.8 · RLS 1 · OPS 0.3 · CST 1.2 |
| Emerging BI team | 3 to 5 people, correct star schema, SQL views, .pbix repository, visual tests. | MOD 2.5 · DAX 2.3 · TST 1.5 · IND 1.8 · RLS 2.2 · OPS 1.5 · CST 2 |
| BI product team | PBIP/TMDL in repository, replayable DAX tests, pipelines, basic monitoring. | MOD 3.6 · DAX 3.5 · TST 3.2 · IND 3.5 · RLS 3.3 · OPS 3 · CST 2.8 |
| Mature BI platform | Certified models, full CI/CD, SLO, cost per usage, tooled accessibility. | Majority between 4 and 4.7; PRF and ACC often lower |
These profiles are illustrative (expert, contextual assessments) and are not based on any survey.
Limits of the matrix#
- It measures practices, not the report's business value: a perfectly industrialized product can be useless (see PD — Cost and Value Steering (Data FinOps)).
- Technologies evolve quickly (Fabric, Direct Lake, Copilot, licensing): volatile facts are marked “(as of 2026-10)” and should be rechecked before decisions.
- Goodhart's law applies: once a metric becomes a target, it stops being a good metric. Each theme lists possible misuses.
- Levels assume average volume and criticality; an internal report for 5 users does not need to target level 5 everywhere.
- Difficulty and effort ratings /5 are expert assessments.
See also#
- Other matrices: Maturity Matrix — IT Project Management (PI) · Maturity Matrix — Software Development (code DL) · Maturity Matrix — Data Project Management (PD) · Self-Assessment with Maturity Matrices · Matrix Portal
- Tools: Source Control for Data: SQL and Power BI · Git In Depth · TFVC in Depth
- Reporting: Cross-Cutting Power BI Good Practices · Power BI Reporting Project Checklists · Comparison — OneLake / Fabric vs Managed SQL Server for Power BI Reporting
- Glossary · Rating: Reading Ratings, Scores, and the Legend · Reading Paths
✻ Written by Claude Sonnet 5.5
