

- Description
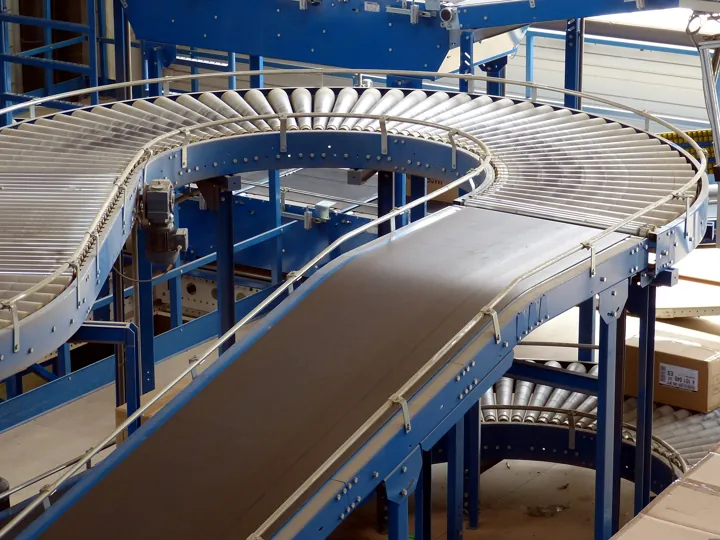
- Convoyeurs à rouleaux et à bande d'une usine, en courbes bleues enchaînées.
- Source
- falco (Pixabay) · original page
- Licence
- CC0 Public domain
 Continuous Integration and Continuous Delivery
This topic measures the speed and safety with which a validated change becomes a deployable deliverable. The indicators are those from DORA research (delivery frequency, lead time for…
In brief
This topic measures the speed and safety with which a validated change becomes a deployable deliverable. The indicators are those from DORA research (delivery frequency, lead time for changes, change failure rate, recovery time) applied to the build and promotion pipeline; production operations are covered under 06.
Level: 🟢→🔴 · Topic code: CIC (DL matrix)
Why this topic#
Continuous integration checks at every change that everything still holds together; continuous delivery ensures you can release at any time, without ceremony. Without this, delivery is a rare, high-pressure, manual event that depends on specific people — the opposite of a team capability. The Accelerate research and DORA reports have shown that high-performing teams combine speed and stability: delivering more often does not degrade quality, it improves it, because batch sizes are small.
DORA's four historical measures: deployment frequency, lead time between a validated change and its release to production, change failure rate, and time to restore service. DORA has since expanded its model: recovery time became “failed deployment recovery time” (limited to failures caused by a change), and a fifth measure, deployment rework rate, was added; current thresholds should be checked on the DORA website. This topic is based on the spirit of the measures, without copying their thresholds as dogma.
The data case has its own specifics: a pipeline delivering a semantic model or SQL procedures must handle persistent state (schema, loaded history); this is covered in CI/CD for data: foundations, datamarts, pipelines, and reports. Building an installation kit is also an “artifact” that must be produced reproducibly.
What this topic measures#
- Axis: from “build on the developer's workstation” to “automated, reproducible, fast pipeline that promotes the same artifact all the way to production”.
- Key indicators: commit → validated artifact lead time (minutes); delivery frequency (per week); pipeline failure rate not caused by code (%); reproducibility (same commit → same artifact).
- Unit: minutes; deliveries/week; %.
Five-level table#
| Level | Short name | Promise | Typical indicator (orders of magnitude) |
|---|---|---|---|
| 1 | Craft | A release is built by hand, by someone who knows the process. | Build on workstation; release every 3 to 6 months |
| 2 | Scripted | Anyone on the team can produce the deliverable by following a script. | Build script; monthly release |
| 3 | Automated | At each change, a tested deliverable is produced with no manual intervention. | CI pipeline; feedback < 15 min; weekly release |
| 4 | Promoted | The same artifact moves through all environments; a release is a business decision, not a technical effort. | Single artifact; on-demand release; failure < 15% |
| 5 | Continuous | Every validated change can go to production in under an hour, with automatic rollback. | Change → production lead time < 1 day (often < 1 h); recovery < 1 h |
Milestones by level#
| ID | Milestone | Verifiable evidence |
|---|---|---|
| DL-CIC-1.1 | The deliverable can be rebuilt from versioned source | Rebuild by a third party |
| DL-CIC-1.2 | Build steps are listed | Replayable document |
| DL-CIC-1.3 | Released versions carry a unique number | Tracked numbering |
| DL-CIC-2.1 | A single script produces the deliverable (no hidden workstation step) | Successful run on a fresh machine |
| DL-CIC-2.2 | Dependencies are declared and pinned (versions, locking) | Versioned lock file |
| DL-CIC-2.3 | A dedicated build server exists (not a developer's workstation) | Build machine identity |
| DL-CIC-2.4 | Build prerequisites are documented or provisioned as code | Rebuildable environment |
| DL-CIC-3.1 | A pipeline is triggered automatically at every change | Run log |
| DL-CIC-3.2 | The pipeline runs compilation, static analysis, and fast tests in under 15 min | Measured median duration |
| DL-CIC-3.3 | A red pipeline is treated as top priority (team rule) and restored in < 1 h | Measured time back to green |
| DL-CIC-3.4 | The pipeline is defined as code and versioned with the application | Definition in repository |
| DL-CIC-3.5 | Artifacts are published to a repository with checksum and provenance | Browsable artifact repository |
| DL-CIC-4.1 | A single artifact is promoted from environment to environment (not rebuilt) | Same checksum in test and production |
| DL-CIC-4.2 | Configuration is separated from code and injected per environment | No secret or URL in the artifact |
| DL-CIC-4.3 | Promotion gates are automated (tests, analysis, security) with business approval if required | Gate log |
| DL-CIC-4.4 | The pipeline measures the four delivery indicators and publishes them | Up-to-date dashboard |
| DL-CIC-4.5 | The build is reproducible (same commit → same content, timestamp aside) | Proven identical rebuild |
| DL-CIC-5.1 | A validated change reaches production in < 1 day with no manual technical intervention | Measurement over 20 changes |
| DL-CIC-5.2 | A failure detected in production triggers automatic rollback or failover | Successful drill |
| DL-CIC-5.3 | The pipeline self-monitors (duration, instability, queues) and its technical debt is managed | Pipeline health indicators |
| DL-CIC-5.4 | The pipeline itself is tested and rebuildable (build infrastructure as code) | Full factory rebuild in < 1 day |
Detailed reading by level#
🟢 Level 1 — Craft#
- Signs: “only Pierre knows how to run the build”; the deliverable depends on the machine; unwritten manual steps.
- Gain: initial speed.
- Does not guarantee: reproducibility or continuity if the person leaves.
- Difficulty: 1/5 · Effort: 1/5.
🟢 Level 2 — Scripted#
- Signs: one script does everything, pinned dependencies, a build server.
- Gain: anyone can release; process errors go down.
- Does not guarantee: automatic feedback for every change.
- Difficulty: 2/5 · Effort: 2/5.
🟡 Level 3 — Automated#
- Signs: the pipeline is change-triggered, fast, and defined as code. A red pipeline is a team incident.
- Gain: feedback goes from days to minutes; quality becomes continuous.
- Does not guarantee: that the tested artifact is the one deployed.
- Difficulty: 3/5 · Effort: 3/5.
🔴 Level 4 — Promoted#
- Signs: “build once, deploy everywhere”; configuration is external; gates are automated. Delivery becomes a decision.
- Gain: environment surprises disappear; auditing is trivial.
- Does not guarantee: safe operations — see 06.
- Difficulty: 4/5 · Effort: 4/5.
🔴 Level 5 — Continuous#
- Signs: change → production in hours, with automatic rollback, with no one technically “pushing the button”; the pipeline is monitored like a product.
- Gain: the team learns from production at a high pace.
- Does not guarantee: that fast release is always desirable — some contexts (regulated, product delivered on-site) legitimately pace production release.
- Difficulty: 5/5 · Effort: 5/5.
Partial achievement and rating#
Apply the rating rule.
- 0.5 on DL-CIC-4.1: the artifact is promoted for the application but the database is rebuilt in each environment.
- 0.5 on DL-CIC-3.3: pipeline restored in 4 h on average.
- A partial 5: production reached in 2 days with no technical manual step, without automatic rollback.
Pipeline theater. Symptom: green pipeline, manual deployment, tests “temporarily” disabled. Cause: weakened gates to meet a deadline. Remedy: count a bypassed gate; track bypasses.
Rebuilding for each environment. Symptom: “it worked in test.” Cause: a different artifact per environment. Remedy: one single build, injected configuration.
Distinguish delivery (available) and deployment (in production): a product delivered as an installation kit may have high delivery frequency but deployment paced by the customer. Measure what you control.
Moving to the next level#
Possible means (optional)
- 1 → 2: replace manual steps with a script; pin dependencies.
- 2 → 3: pipeline server, automatic triggering, pipeline defined as code; team rule “red pipeline = stop.”
- 3 → 4: artifact repository, externalized configuration, automated gates, indicator measurement.
- 4 → 5: failovers and progressive deployments, automatic rollback, pipeline monitoring.
Datamart installation kit: at level 2, a script produces the kit in 25 min on an identified workstation. At level 4, the pipeline compiles scripts, reruns installation on an empty database and on a database from the previous version, then publishes a single kit with controlled checksum; the same kit is used in acceptance testing and production.
Pipeline generation and failure diagnosis: gain 3/5, risk 3/5 (unpinned third-party actions, secrets exposed in logs). Guardrail: review pipeline definitions as code, pin action versions, no plaintext secrets.
Rewarding deployment frequency encourages artificial splitting; combining it with failure rate and recovery avoids this trap.
See also#
- Neighbors: 03 Testing · 04 Version Control and Branches · 06 Deployment and Operations · 07 Security · 12 Developer Experience and Flow.
- Other matrices: Data — Lead Time and Industrialization (DataOps) · BI — Versioning and Industrialization of Reports · Project — Delivery and Production Release (LIV).
- Practice: CI/CD · CI/CD for data: foundations, datamarts, pipelines, and reports · Azure DevOps / TFS · Project Metrics and Reporting.
- Glossary · Rating: Reading Ratings, Scores, and the Legend.
✻ Written by Claude Sonnet 5.5
