

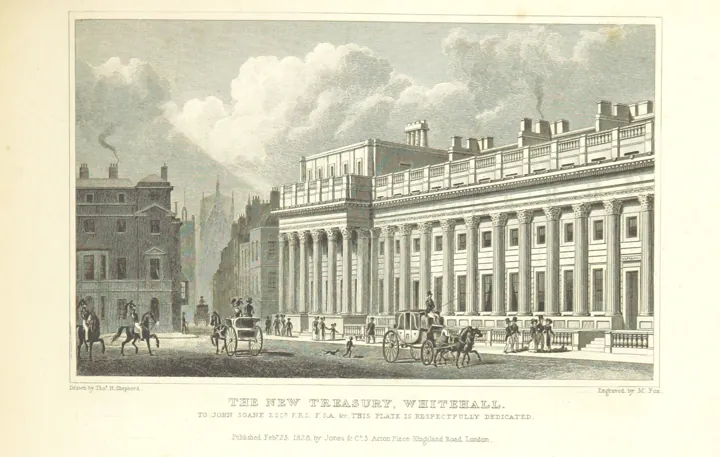
- Description
- Gravure ancienne du Trésor de Whitehall à Londres : une longue colonnade, des calèches et des promeneurs.
- Source
- Thomas Hosmer Shepherd · original page
- Licence
- PD Public domain
 Unrealistic optimism
Everyone knows projects go off track; everyone plans their own as if it should escape it.
In brief
- What : we judge our chances of success as better, and our risks as lower, than those of others in the same situation.
- Why : we picture our plan, believe we're more competent than average, and remember good news better than bad news.
- Detect : “it should be fine,” a single scenario, no buffer, a risk that's never quantified.
- Avoid : reference class, explicit buffer, pre-mortem, commitment to a range.
On this page
- Definition
- Mechanism
- Where you encounter it
- Famous cases
- The UK Treasury institutionalizes an “optimism adjustment” 2002
- Weinstein (1980): “accidents happen to other people” 1980
- Crédit Lyonnais: losses repeatedly underestimated (France) 1988-2000
- The Flamanville EPR: €3.3 billion announced, €23.7 billion estimated (France) 2006-2025
- The price shield: protection designed for one winter (France) 2021-2024
- Detection signals
- Avoidance reflexes
- With AI: detect, fix, mitigate
- Limits
- Sources and verification
- See also
Definition#
 Fictitious illustration
Unrealistic optimism (optimism bias, or unrealistic optimism) is the tendency to believe that we are more likely than others to experience favorable events, and less likely to experience unfavorable events. Neil Weinstein described it in 1980 regarding everyday life events; the idea was later applied to project forecasting.
It should not be confused with an optimistic temperament, which is often useful for action. The bias starts when optimism gets into the calculation: a duration, a cost, a probability of success are estimated more favorably than the data justify. It is close to The Planning Fallacy, which is its most measurable manifestation, but it is broader: it also concerns risks, expected benefits, and user adoption.
Mechanism#
Several drivers combine:
- Comparison to oneself : we think about the project we're going to run, with our skills and our team, not the average of similar projects. Statistics apply to “other people.”
- Illusion of control : we overestimate what we can influence, so we underestimate what comes from outside (see The illusion of control).
- Asymmetric updating : according to work by Tali Sharot and colleagues, we revise our beliefs more in response to good news than to bad news. So the announced risk is only partially integrated.
- Interest in believing it : a project first has to be approved; the flattering plan is the one that gets through.
In Weinstein's study (1980), students assessed their chances of experiencing different life events, pleasant (getting a good job, living a long life) or unpleasant (getting divorced, becoming ill), compared with those of their classmates. On average, they judged themselves luckier than others for favorable events, and less exposed for unfavorable events. Yet by construction, a group's average cannot be better than the group's average. Tali Sharot estimates that a large majority of people, about 80% according to her often-cited estimates, would show this bias (order of magnitude, not a precise measurement).
Where you encounter it#
In project management#
- Planning and sprint commitment : the sprint is filled to 100% of theoretical capacity, as if no one will be absent, interrupted, or blocked.
- Single scenario : the date relies on a chain where every task finishes on time, every third-party delivery arrives, every test passes on the first try.
- Risk register : probabilities are set to “low” by default; risks that depend on the team itself are judged almost zero.
- Expected benefits : user adoption, productivity gains, and payback period from the initial business case are rarely revised downward.
- Client communication : a “likely” date is presented as certain, with no range, because any caveat would look like a lack of confidence.
In management#
- Recruitment and skill ramp-up : we assume a new hire will be autonomous in two weeks, that training “will happen in parallel.”
- Goals : goals are set assuming everything will go like in the best quarter, without accounting for departures, vacations, or emergencies.
- Change management : “teams will naturally buy in”; resistance is treated as a special case rather than the rule.
- Self-assessment : everyone thinks their own projects will be less affected than those of other departments.
Famous cases#
The UK Treasury institutionalizes an “optimism adjustment” 2002#
Bias at play: unrealistic optimism in major public-project budgets.
What happened. In 2002, the UK Treasury asked engineering consultancy Mott MacDonald to review about fifty major public projects. Finding: projected costs and timelines at the decision point were systematically exceeded. The Green Book, the official project appraisal guide, drew a rule from this: project sponsors must apply an optimism uplift to their estimates based on project type, and can reduce it only by demonstrating control of their risks. The uplifts recommended in 2002 ranged, for capital spending, from about 24% for standard buildings to 200% for equipment and development projects. The Treasury has since updated these recommendations, but the principle remains: the government no longer trusts the estimate produced by the project owner.
Recommended optimism uplift in 2002 (upper bound, capital spending)
Loading the chart…
View the data
| Upper bound (%) | |
|---|---|
| Standard buildings | 24 |
| Non-standard buildings | 51 |
| Standard civil engineering | 44 |
| Non-standard civil engineering | 66 |
| Equipment / development | 200 |
| Outsourcing | 41 |
What this illustrates
An organization that knows its estimates are optimistic can correct this by rule, without waiting for every project manager to become clear-eyed. Applied to your own estimating: apply a coefficient to the raw estimate drawn from your own history (actual/estimated ratio by project type), and require justification for deviating from it. Equipment and development projects, the most uncertain, are also those receiving the largest adjustment: the more you innovate, the more fragile the estimate.
Weinstein (1980): “accidents happen to other people” 1980#
Bias at play: unrealistic optimism (comparison with others).
Neil Weinstein, a psychologist at Rutgers University, published a 1980 study in the Journal of Personality and Social Psychology on unrealistic optimism about future events. Students estimated the likelihood of around forty events, positive and negative, compared with that of an “average” student in their own group. Result: overall, they believed they were luckier than average. Weinstein also examined the factors sustaining this bias, especially the belief that the event is controllable and the lack of personal experience with the issue.
What this illustrates
In a team, it is the same: everyone admits that “projects in general” slip, but not that their own project will slip. So presenting delay statistics is not enough to correct the bias: you must apply them mechanically to the plan (buffer, range), not just remind people of them.
Crédit Lyonnais: losses repeatedly underestimated (France) 1988-2000#
Bias at play: unrealistic optimism (accepted, unproven) in loss estimation; optimism explains only part of it.
What happened. From the late 1980s, Crédit Lyonnais, a state-controlled bank, expanded rapidly: a “bank-industry” model with some 1,500 equity stakes, external growth in Europe, and real-estate lending. The real-estate market reversal starting in 1990 weakened its claims. The bank reported a 6.9 billion franc loss (group share) for 1993, and the estimate of its provisioning shortfall was revised upward: 14 billion francs as of June 30, 1993, according to the Banking Commission. In its July 1994 report, the National Assembly inquiry commission (chair Philippe Séguin, rapporteur François d'Aubert) noted 42.6 billion francs in assets transferred into a bad-asset structure, insufficient central procedures, and subsidiaries left “on a loose rein.” In 1995, troubled assets were placed in the Consortium de réalisation (CDR) with state support. In 2000, the Cour des comptes found that the loss simulations underpinning these arrangements relied on assumptions “either deliberately optimistic, or called into question during negotiations,” that the bank's profits had been assessed too optimistically, and CDR losses underestimated; it put the cost of the wind-down at between 110 and 120 billion francs in 1999 value.
Where the bias appears. What is established is the facts: loss and profit forecasts that were repeatedly too favorable, then revised upward. What is interpretation is seeing unrealistic optimism in this—that is, the sincere belief that the market would turn around and losses would remain limited. Another explanation carries significant weight: the Court itself speaks of “deliberately” optimistic assumptions, and notes that showing lower loss estimates supported negotiations with the European Commission. So if bias was at play, it explains only part of the case, alongside strategic choices and communication calculations. Level of evidence: accepted, unproven. The reports establish overly optimistic assumptions, not the mindset of those who selected them.
What this illustrates
A loss forecast that never turns out too pessimistic is a warning sign: have it independently reviewed by someone with no stake in good news, and compare it with overruns seen in comparable cases before approving it.
The Flamanville EPR: €3.3 billion announced, €23.7 billion estimated (France) 2006-2025#
Bias at play: unrealistic optimism (at the beginning: an initial budget), among other causes.
What happened. In May 2006, EDF launched construction of an EPR at Flamanville for €3.2 to €3.3 billion in 2005 euros. This estimate came from an extrapolation made in 2003 from the N4 reactor (€3,314M2001) and a similar price, about €3,000M, announced by Areva/Siemens for the Finnish reactor. The announced cost was raised several times: €4bn in 2008, €6bn in 2011, €8.5bn in 2012, €10.5bn in 2015, then €12.4bn2015 in 2019, i.e., 3.3 times the initial value according to the Cour des comptes (2020). In 2025, the Court recalculated a total cost of about €23.7bn2023 including interest during construction.
Where the bias appears. The Folz report (2019) states that initial estimates for major projects are typically “affected by optimism bias,” but that Flamanville's should be described, “at best,” as unrealistic. It establishes that EDF “grossly underestimated” the size and complexity gap between N4 and EPR: volume and scope effects alone explain about €2.3bn, nearly 70% of the initial estimate. The Cour des comptes (2020) speaks of “unrealistic starting estimates.” Both reports establish that the budget was unrealistic, not its cause: sincere optimism, an overly favorable comparison with the Finnish offer, or a figure chosen to win approval (see the The Planning Fallacy page, which details the timeline). Most of the overrun comes from delays, contingencies, and organizational failures, not from initial optimism. Level of evidence: accepted, unproven. The unrealistic budget is established; its cognitive origin is an interpretation, which the Folz report itself deems insufficient.
What this illustrates
Add to every major-project budget an adjustment based on overruns observed in comparable projects, as the UK Treasury does, and require the estimate to state what distinguishes it from extrapolating from a simpler earlier project.
The price shield: protection designed for one winter (France) 2021-2024#
Bias at play: unrealistic optimism (the assumption of a short-lived shock).
What happened. In fall 2021, faced with surging gas prices then electricity prices, the government introduced price shields (gas in late 2021, electricity on February 1, 2022). According to the Cour des comptes, they were initially temporary: freezing regulated tariffs was supposed to be followed, from July 2022 for gas and in 2023 for electricity, by tariff catch-up avoiding a net cost to the state, pending a return to normal market conditions in spring or summer 2022. Russia's invasion of Ukraine pushed that outlook farther away: the shields were extended in 2022, then in 2023 with a 15% increase in frozen tariffs, and the electricity shield continued in 2024. In its March 2024 report, the Court put the state's net financing need for 2021-2024 at €36bn and noted mechanisms with no targeting and no volume cap.
Where the bias appears. Unrealistic optimism means choosing the favorable scenario for planning. Here, the financing scheme (tariff catch-up neutralizing the cost) assumed a short-lived price shock, which authorities “thought would be limited to the winter 2022-2023 period,” according to the Court. Established: this design assumption and the inability to maintain it, with the gas shield becoming sustainable again only a year later. Interpretation: viewing this as optimism bias rather than genuine market uncertainty; the Court notes that the crisis was exceptional and that a major external shock occurred, explaining most of the gap. Level of evidence: accepted, unproven. The initial assumption is documented; its biased nature is not.
What this illustrates
For aid presented as temporary, first write the unfavorable scenario (duration doubled) and what the state will pay in that case, before deciding.
Detection signals#
- “It should be fine.” “Normally, it’ll be fine.” “At worst, one extra day.”
- The plan includes only one scenario: no pessimistic alternative.
- The risk register contains few risks, all “low,” and none related to the team itself.
- Every past overrun is presented as a special case, never as a trend.
- Sprint capacity is calculated at 100%, with no vacation, no support, no bug fixes.
- Key assumptions (third-party delivery, expert availability, access to an environment) are neither listed nor dated.
Avoidance reflexes#
- Take the outside view. Look at how many comparable projects met their deadlines and budgets; start from that rate, then explain why yours would do better.
- Apply an optimism uplift. On your past projects, calculate the actual/estimated ratio and apply it to the raw estimate, as the UK Treasury does.
- Run a premortem. “It’s six months from now, the project has failed: what happened?” This framing allows people to say what they were thinking but not saying.
- Commit to a range. Announce a “one-in-two chance” value and a “four-in-five chance” value, not just a single number.
- Assign a devil’s advocate for every launch decision or milestone gate, tasked with defending the unfavorable scenario.
- Date and track assumptions. An assumption with no owner and no review date is a wish.
- Reward bad news raised early. If reporting a risk costs more than hiding it, the team will learn to be optimistic only.
With AI: detect, fix, mitigate#
AI is useful for methodically looking for what can go wrong and for reviewing a plan to find implicit assumptions: it has neither the data project manager’s ego nor their drive to succeed. But it also tends to validate what it is given and produce smooth-looking plans (Jones and Steinhardt, 2022): its criticism is useful only if you ask for it explicitly.
Detect#
- Identify optimistic language in a plan or meeting notes (“should,” “normally,” “just,” “no problem”).
- List the schedule’s implicit assumptions, with their confidence level.
- Compare estimates against exported history (tickets, milestones) to calculate the usual gap.
Fix#
- Produce a detailed premortem based on the project description.
- Turn a single estimate into a justified range.
- Suggest a list of common risks for this type of project (migration, integration, data migration).
Mitigate#
- Have AI play the devil’s advocate before each decision milestone.
- Request an anonymous critical review of the schedule before it is presented.
- Have it summarize past gaps between planned and actual at each retrospective.
Prompts to integrate into your practices#
1. Guided premortem. To run before validating a schedule or committing in front of a client.
It is [six months] from now and project [name, scope in three lines] has failed: it is more than 50% late and the client is unhappy.
Write the most plausible story of this failure, as ten causes ranked from most likely to least likely. For each: what happened, the signal that should have alerted us, and one preventive action we can decide today.
Do not write any generic cause: base your analysis on the context below.

Context: [team, technologies, dependencies, timeline, constraints]
2. Hunt for optimistic assumptions. On a schedule, estimate, or decision file.
Here is a schedule (or estimate): [text].
1. List all implicit assumptions it relies on (availability, third-party deliveries, no defects, fast decision-making).
2. For each one, assess how fragile it is (low / medium / high) and explain what happens to the timeline if it is wrong.
3. Identify optimistic wording (“should,” “normally,” “just”).
4. Propose a three-point range (optimistic, likely, pessimistic) and justify each gap.
Do not validate the schedule: look for what could make it fail.
How to integrate them#
- During estimating: prompt 2 is used for systematic review, before sending a date to the client.
- At decision milestones: prompt 1 feeds committee discussion, to be read before the meeting.
- In retrospectives: comparing what AI had flagged with what actually happened improves both future use of AI and team judgment.
Precautions#
- Give AI the raw plan, without commentary: an enthusiastic presentation makes it enthusiastic too.
- The causes it proposes are hypotheses to test, not facts; references or figures it cites must be verified.
- It does not know your past gaps: provide your history, otherwise it will only produce generalities.
- Do not send confidential project data to an unauthorized tool.
Limits#
- Optimism is not always a flaw: it supports motivation and commitment, and without it many useful projects would never be launched. The issue is not believing in success, it is budgeting as if success were already achieved.
- The size of the bias varies by person, culture, and situation: it is stronger when people feel responsible for the outcome and when risk is seen as avoidable.
- UK Treasury uplifts are historical averages from large public projects; they cannot be directly transferred to a small software project.
- The concept covers distinct phenomena (comparison with others, underestimation of one’s own risks, asymmetric updating) that research increasingly treats separately.
Sources and verification#
- Weinstein (1980), “Unrealistic optimism about future life events,” Journal of Personality and Social Psychology
- Sharot (2011), “The optimism bias,” Current Biology — synthesis, including the share of people affected.
- Lovallo & Kahneman (2003), “Delusions of Success: How Optimism Undermines Executives' Decisions,” Harvard Business Review
- Buehler, Griffin & Ross (1994), “Exploring the planning fallacy,” Journal of Personality and Social Psychology
- Flyvbjerg (2014), “What You Should Know About Megaprojects and Why: An Overview,” Project Management Journal
- Mott MacDonald (2002), Review of Large Public Procurement in the UK, study for HM Treasury; HM Treasury, The Green Book and its supplementary guidance on optimism (Supplementary Green Book Guidance: Optimism Bias) — uplifts by project type.
- Jones & Steinhardt (2022), “Capturing Failures of Large Language Models via Human Cognitive Biases” — cognitive biases in language models.
- French National Assembly (1994), “Report of the inquiry commission on Crédit Lyonnais” (No. 1480, rapporteur François d'Aubert, chair Philippe Séguin) — details expansion, 1993 losses, real estate asset transfers, and inadequate controls.
- Court of Auditors (2000), “State intervention in the financial sector crisis,” report to the President of the Republic — establishes the optimistic nature of workout assumptions and the operation’s cost.
- Jean-Martin Folz (October 2019), “The construction of the Flamanville EPR,” report to EDF’s Chairman and CEO — states the initial estimate, describes it as unrealistic “at best,” and estimates at about €2.3B the share due to volume and scope.
- Court of Auditors (July 9, 2020), “The EPR sector,” thematic public report — establishes a construction cost multiplied by 3.3 (€12.4B2015) based on “unrealistic initial estimates.”
- Court of Auditors (January 14, 2025), “The EPR sector: new momentum, persistent risks,” summary — estimates Flamanville 3 total cost at about €23.7B2023, including financing costs during construction.
- Court of Auditors (2024), “Exceptional measures to fight rising energy prices,” thematic public report — establishes the initially temporary nature of the shields, their successive extensions, the net cost of €36B over 2021-2024, and weak targeting.
See also#
Related biases#
Variants or cousins: not to be confused.
