

- Description
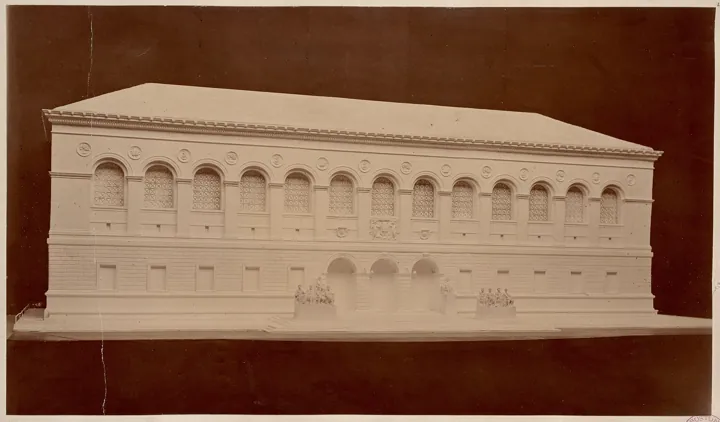
- Maquette en plâtre d'une bibliothèque, photographiée avant la construction : le modèle précède l'édifice
- Source
- McKim, Mead & White · original page
- Licence
- PD Public domain
 Modeling and Architecture
The data model is the most durable decision in a data project: code can be rewritten, a report can be rebuilt, but a poorly designed model spreads into every report that…
Level: 🟢→🔴 · Theme code: MOD
Why this theme#
The data model is the most durable decision in a data project: code can be rewritten, a report can be rebuilt, but a poorly designed model spreads into every report that consumes it and can only be fixed through migration. A good model expresses the business (you can read entities, grains, and rules), absorbs change (new source, new attribute, historization), and remains understandable to a newcomer. A bad model is recognized by daily symptoms: every new report requires new processing, the same joins are rewritten everywhere, history is missing when needed. This theme covers the management of modeling (decisions, conventions, evolution, migration). A report’s semantic model (relationships, measures, RLS) is covered on the BI side: BI matrix — Semantic Model.
What this theme measures#
- Axis: from accidental model to designed, governed, and evolvable model.
- Key indicator: cost of a standard change (adding an attribute, a source, a dimension) in days, and share of the model complying with conventions.
- Unit: days to integrate an attribute; % of objects compliant with conventions; number of consumer breaks per evolution.
The five levels#
| Level | Short name | Promise | Typical indicator (order of magnitude) |
|---|---|---|---|
| 1 | Accidental | Each report gets the data it needs, often through a dedicated table. | Adding an attribute: several days, multiple places |
| 2 | Shared | Main entities (customer, product, date) are common to multiple reports. | Shared dimensions across the top 3–5 topics |
| 3 | Designed | The model follows a method (star, domain-based) with explicit grain and written conventions. | ≥ 90% of tables with documented grain; attribute added in < 1 day |
| 4 | Evolvable | The model absorbs historization, source changes, and rule changes without breaking consumers. | Break-free evolution ≥ 90%; history reconstructable |
| 5 | Adaptive | The model evolves in controlled small steps, with automated migration and measured evolution cost. | Adding a dimension in hours; model debt tracked |
Milestones by level#
| ID | Milestone | Verifiable evidence |
|---|---|---|
| PD-MOD-1.1 | A physical schema exists and can be consulted (diagram or script). | Dated schema export. |
| PD-MOD-1.2 | Tables have declared or identifiable primary keys. | PK check: list of tables without keys. |
| PD-MOD-1.3 | Sources are distinguished from presentation tables (zones or schemas). | Visible separation in schema names. |
| PD-MOD-1.4 | Date and calendar are handled through a single table. | Date table used by reports. |
| PD-MOD-2.1 | Main dimensions are shared across reports (no per-report copies). | Same table used by ≥ 2 reports. |
| PD-MOD-2.2 | The grain of each fact table is written (“one row per reading and per product”). | Table description with grain statement. |
| PD-MOD-2.3 | Naming conventions exist (prefixes, casing, abbreviations) and are followed for new items. | Conventions document; sample review. |
| PD-MOD-2.4 | Surrogate keys and business keys are distinguished. | Schema showing both key types. |
| PD-MOD-3.1 | The model follows an explicit method (Kimball-style star, domain-based…) described on one page. | Architecture document; cited reference work (e.g., The Data Warehouse Toolkit). |
| PD-MOD-3.2 | Fact-to-dimension relationships are declared and their behavior decided by rule (joins, roles). | Fact × dimension matrix (bus matrix). |
| PD-MOD-3.3 | Historization is decided by attribute (overwritten, historized, versioned) and documented. | Attribute table with historization type. |
| PD-MOD-3.4 | Every major model decision is recorded (decision, alternatives, rationale). | Architecture decision log. |
| PD-MOD-4.1 | Adding a source or attribute does not break any consumer (backward compatibility). | Non-regression test on exposed objects. |
| PD-MOD-4.2 | A stable presentation layer isolates reports from internal tables. | Contractual views or presentation schema (CTR). |
| PD-MOD-4.3 | Reference-value history can be reconstructed for a given date. | “As of date” query validated on a case. |
| PD-MOD-4.4 | Model migrations are scripted, replayable, and tested on a copy. | Versioned migration scripts with test report. |
| PD-MOD-5.1 | Model evolution cost is measured (lead time for a standard change). | Measurement series over ≥ 6 changes. |
| PD-MOD-5.2 | Model debt (duplicates, convention deviations) is inventoried and reduced. | Inventory with quarterly trend. |
| PD-MOD-5.3 | Periodic architecture reviews compare the model with real usage (never-read tables, frequent joins). | Review report based on usage statistics. |
| PD-MOD-5.4 | A change of engine or hosting is possible without redesigning the logical model. | Porting exercise or documented analysis. |
Detailed reading by level#
🟢 Level 1 — Accidental#
- Signs: one table per report; different joins for the same concept; inconsistent names.
- Benefit: fast delivery of the first report.
- Does not guarantee: reuse; consistency of figures across reports.
- Difficulty: 1/5 · Effort: 1/5.
🟢 Level 2 — Shared#
- Signs: shared dimensions; grain is stated verbally or in comments; conventions start to appear.
- Benefit: two reports on the same topic align more often.
- Does not guarantee: a model understandable by a newcomer.
- Difficulty: 2/5 · Effort: 2/5.
🟡 Level 3 — Designed#
- Signs: bus matrix, written grain, historization decided attribute by attribute, decision log.
- Benefit: an attribute is added without rethinking structure; debates are settled by method.
- Does not guarantee: resilience under a major source change.
- Difficulty: 3/5 · Effort: 3/5.
A sales-force datamart moves from “one wide readings table” to a star: Releve facts (grain: one product recorded per visit),
Date, PointDeVente, Produit, Utilisateur dimensions. A bus matrix shows Produit is shared with sales. Adding a “pillar” attribute
on Produit goes from three days (updating 6 reports) to half a day (one column, one test).
🟡 Level 4 — Evolvable#
- Signs: a stable presentation layer; history can be reconstructed; migrations replay on a copy.
- Benefit: the model can change without notifying everyone.
- Does not guarantee: business relevance (a good model of the wrong topic is still useless).
- Difficulty: 4/5 · Effort: 4/5.
-- Type 2 dimension with validity range historization, “as of date” query
SELECT P.PRD_COD, P.PRD_LIB, P.PRD_PILIER
FROM   [dim].[Produit] AS P WITH (NOLOCK)
WHERE  @JourJ >= P.DATE_DEBUT_VALIDITE
  AND  @JourJ <  ISNULL(P.DATE_FIN_VALIDITE, '9999-12-31');
🔴 Level 5 — Adaptive#
- Signs: change cost is a tracked curve; model debt is budgeted; usage guides architecture.
- Benefit: a platform that remains modifiable at 10 times its initial size.
- Does not guarantee: no redesign; a paradigm shift (streaming, lakehouse) may still be costly.
- Difficulty: 5/5 · Effort: 4/5.
Partial achievement and rating#
Check milestones on the five main fact tables and their dimensions. A modeling milestone is rated based on the share of compliant objects: 1 if ≥ 90%, 0.5 if 50–90%, 0 below that. Level 5.x milestones are rated on measurement evidence, not intent.
A “partial 5”: change cost is measured on ten evolutions (5.1 at 1), debt is inventoried without a trajectory (5.2 at 0.5), usage review is annual and portability analysis does not exist (5.3 at 0.5; 5.4 at 0).
Facade star schema: DIM_/FACT_ names applied to tables with mixed grains. Symptom: measures doubling after joins. Cause: grain not written. Remedy: the grain statement is a prerequisite for any fact table.
Renaming a consumed column: the consumer breaks even if the table is correct. Ship the new column first, migrate consumers, remove the old one (see CTR level 4).
One stable surrogate identifier per dimension makes future incremental loading possible and protects report relationships when the business key changes.
Move to the next level#
Possible means (optional)
| Transition | Possible levers |
|---|---|
| 1 → 2 | Isolate a set of shared dimensions; write a one-page conventions document. |
| 2 → 3 | Build the bus matrix; write the grain statement for each fact; keep a decision log. |
| 3 → 4 | Introduce the presentation layer; script migrations; non-regression tests (REC). |
| 4 → 5 | Measure evolution cost; review real usage (never-read tables, frequent joins). |
Cross-cutting pitfalls: (1) False positive — a “clean” model that does not answer real questions; review it with the decision list from VAL. (2) Goodhart — aiming for “100% compliant tables” encourages renaming rather than designing. (3) Over-engineering — extreme normalization for modest volume.
Useful for proposing a star from a source schema, generating migration scripts, or detecting convention deviations. AI does not know the intended business grain and may propose a formally correct model that is unrelated to the decisions to be informed; the grain statement remains a human responsibility.
See also#
- Same matrix: 04 Contracts · 06 DataOps · 12 Metadata · 03 Quality · README
- Other matrices: DL — Architecture and Design · DL — Technical Debt and Maintainability · BI — Semantic Model · BI — Performance and Data Volume
- Practice: Methods Specific to Data Projects · SQL Server in SaaS — Overview · Comparison — OneLake/Fabric vs Managed SQL Server for Power BI Reporting · Version Control for Data: SQL and Power BI
- Glossary · Rating
✻ Written by Claude Sonnet 5.5
