

- Description
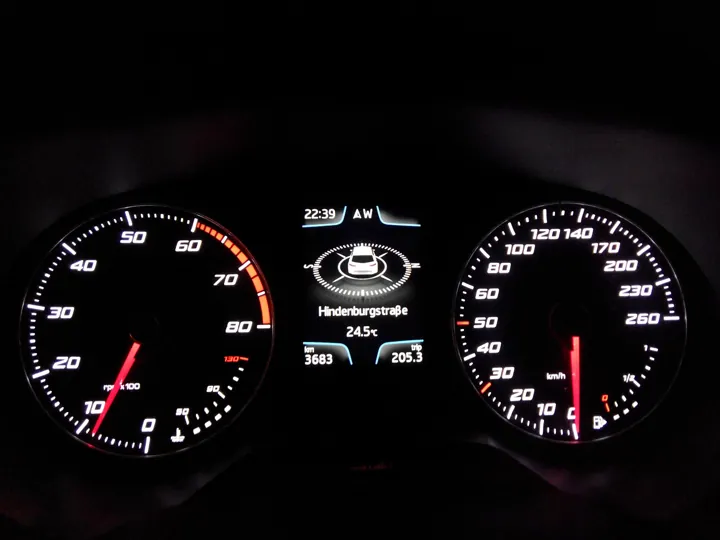
- Tableau de bord d'automobile de nuit : compte-tours et compteur de vitesse aux aiguilles rouges.
- Source
- Spacekid · original page
- Licence
- CC0 Public domain
 Performance and Scalability
This theme measures the software's ability to maintain its response times and processing times as volume or load increase, and the team's ability to prove it before…
In brief
This theme measures the software's ability to maintain its response times and processing times as volume or load increase, and the team's ability to prove it before production. Commitments are expressed in latency percentiles, processing duration, and growth margin. Performance specific to reports and the semantic model is covered in BI 03.
Level: 🟢→🔴 · Theme code: PRF (DL matrix)
Why this theme#
Performance is technical debt that shows up all at once: everything works with the acceptance testing dataset, then real volume multiplies runtime by ten or a hundred because an algorithm is quadratic, an index is missing, or an execution plan changed. Little's Law (the average number of items in a system equals throughput multiplied by average time in system) reminds us that a saturated system sees delays explode nonlinearly: at 90% utilization, the queue is already long.
Two golden rules: measure before optimizing (intuition gets bottlenecks wrong), and reason in percentiles rather than averages (a p50 at 200 ms with a p99 at 8 s is poor service for 1 request out of 100). For batch data processing, the equivalent is the processing window: total duration, margin before the critical time, growth relative to volume.
Measurement variability: on shared platforms (elastic pool, shared capacity), elapsed time can vary by a factor of two from one run to another; measuring CPU consumption and logical reads, multiple times and in alternation, is more reliable than comparing single durations.
What the theme measures#
- Axis: from “we discover slowdowns in production” to “performance is a design criterion that is tested, budgeted, and monitored.”
- Key indicators: p95/p99 latency of critical operations; processing window duration and margin; elasticity (cost and time to absorb ×2 volume); share of performance regressions detected before production.
- Unit: ms/s; minutes; ratio; %.
Five-level table#
| Level | Short name | Commitment | Typical indicator (orders of magnitude) |
|---|---|---|---|
| 1 | Suffered | Performance is known only when it becomes a problem. | No measurement; complaints |
| 2 | Measured | We know how long each critical operation takes today. | Spot measurements; quantified baseline |
| 3 | Budgeted | Each critical operation has a budget, and overruns are seen before delivery. | Budgets; non-regression test; documented p95 |
| 4 | Projected | We know what ×3 or ×10 volume will produce, and the cost to absorb it. | Load tests on target volumes; margin ≥ 50% |
| 5 | Elastic | The system adapts to load without intervention, with cost proportional to usage. | Automatic scaling; cost per service unit tracked |
Milestones by level#
| ID | Milestone | Verifiable evidence |
|---|---|---|
| DL-PRF-1.1 | The operations most sensitive to slowness are identified | List of 5 to 10 critical operations |
| DL-PRF-1.2 | Processing durations are logged | Browsable history |
| DL-PRF-1.3 | Production resources (CPU, memory, storage, I/O) are observable | Dashboard available |
| DL-PRF-2.1 | A baseline measurement exists for each critical operation (p50/p95) | Dated table |
| DL-PRF-2.2 | Measurements are taken on a dataset with representative volume | Volume compared with production (≥ 50%) |
| DL-PRF-2.3 | The measurement method is written down (repetitions, cache state, conditions) | Written protocol |
| DL-PRF-2.4 | Execution plans for critical queries are kept and understood | Archived plans |
| DL-PRF-3.1 | Each critical operation has a performance budget (time, resources) validated with the business | Budget document |
| DL-PRF-3.2 | An automated performance test detects regressions in CI or overnight | A deliberate regression is detected |
| DL-PRF-3.3 | Optimizations are decided based on measurement (profile, plan), never intuition | Before/after file for 5 optimizations |
| DL-PRF-3.4 | Data access is analyzed regularly (indexes, N+1 queries, locks) | Quarterly review |
| DL-PRF-3.5 | The processing window and its margin are known | Duration / available window |
| DL-PRF-4.1 | Load tests are run on volumes ≥ 3× current volume | Test reports |
| DL-PRF-4.2 | The algorithmic complexity of bulk processing is analyzed (time growth with volume) | Duration = f(volume) curves |
| DL-PRF-4.3 | A capacity plan projects 12-month usage and cost | Dated, revised plan |
| DL-PRF-4.4 | Bulk processing is incremental or partitionable when volume requires it | Partial processing proven |
| DL-PRF-4.5 | Processing window margin is ≥ 50% | Measurement over 3 months |
| DL-PRF-5.1 | Scaling is automatic or triggered in < 1 h based on indicator | Load ramp-up test |
| DL-PRF-5.2 | Cost per service unit (per user, per million rows) is tracked | Cost curve |
| DL-PRF-5.3 | Performance regressions in production are detected in < 1 day by comparison with baseline | Drift alert |
| DL-PRF-5.4 | Design choices are validated by load prototypes before commitment | Prototype file |
Detailed reading by level#
🟢 Level 1 — Suffered#
- Signs: “it's been slow since Monday”; emergency fixes; indexes added blindly.
- Benefit: no investment.
- Does not guarantee: that slowness remains manageable as volume grows.
- Difficulty: 1/5 · Effort: 1/5.
🟢 Level 2 — Measured#
- Signs: a baseline duration table, a representative dataset, preserved execution plans. The team talks in numbers.
- Benefit: a comparison baseline; end of opinion debates.
- Does not guarantee: anticipation.
- Difficulty: 2/5 · Effort: 2/5.
🟡 Level 3 — Budgeted#
- Signs: a budget (“the page loads in under 2 s at p95,” “consolidation finishes in under 90 min”) and a test that fails if it is exceeded. Optimizations are documented before/after.
- Benefit: regressions are caught at the source.
- Does not guarantee: holding up at higher volume.
- Difficulty: 3/5 · Effort: 3/5.
🔴 Level 4 — Projected#
- Signs: we plot duration = f(volume) to know whether growth is linear or quadratic; we test at ×3; we have a capacity plan. A process that goes from 20 min to 80 min when volume doubles is a signal of excessive complexity.
- Benefit: we invest before failure, not after.
- Does not guarantee: automatic elasticity.
- Difficulty: 4/5 · Effort: 4/5.
🔴 Level 5 — Elastic#
- Signs: indicator-based scaling; usage-based cost; drift detected in production.
- Benefit: performance and cost follow demand.
- Does not guarantee: cost control without governance — elasticity can also cause the bill to drift.
- Difficulty: 5/5 · Effort: 5/5.
Partial achievement and rating#
Apply the rating rule.
- 0.5 on DL-PRF-3.2: the performance test exists, but runs only before major releases.
- 0.5 on DL-PRF-4.1: load tests only at ×1.5.
- A partial 5: cost per service unit is tracked, scaling is still manual.
Optimizing without measuring. Symptom: three weeks to gain 2% on a step that accounts for 3% of the total. Cause: intuition. Remedy: profile first; target the largest share of total time.
Dataset too clean. Symptom: everything is fast in acceptance testing, slow in production. Cause: non-representative volumes, value distribution, and statistics (parameter bias, asymmetry). Remedy: realistic-volume dataset and real (anonymized) distribution.
Measure across several runs in alternation (A, B, A, B…) rather than in sequence; on a shared platform, compare CPU consumption and logical reads, not just elapsed time.
A consolidation goes from 40 to 48 min with +20% volume (linear growth, comfortable margin). After adding a join on a non-indexed column, it goes from 48 min to 3 h: the overnight non-regression test (milestone 3.2) would have flagged it the next day, and the preserved execution plan (2.4) shows a full scan.
A budget set on the average is met by sacrificing extreme cases. Set it on a high percentile and monitor the tail.
Moving to the next level#
Possible means (optional)
- 1 → 2: baseline table, real-volume dataset, plan archiving.
- 2 → 3: budgets shared with the business, overnight non-regression test.
- 3 → 4: tests at ×3, duration-volume curves, incremental or partitioned processing, capacity plan.
- 4 → 5: automatic scaling, unit cost tracking, production drift detection.
See also#
- Neighbors: 01 Architecture · 03 Testing · 08 Observability · 09 Technical Debt.
- Other matrices: BI — performance and data volume · BI — cost, licensing, and capacity · Data — cost and value steering.
- Practice: CI/CD for data: foundations, datamarts, pipelines, and reports · Pitfalls and Good Practices in Project Management (Cross-Functional Synthesis) · Source Control for Data: SQL and Power BI.
- Glossary · Rating: Reading Ratings, Scores, and the Legend.
✻ Written by Claude Sonnet 5.5
