

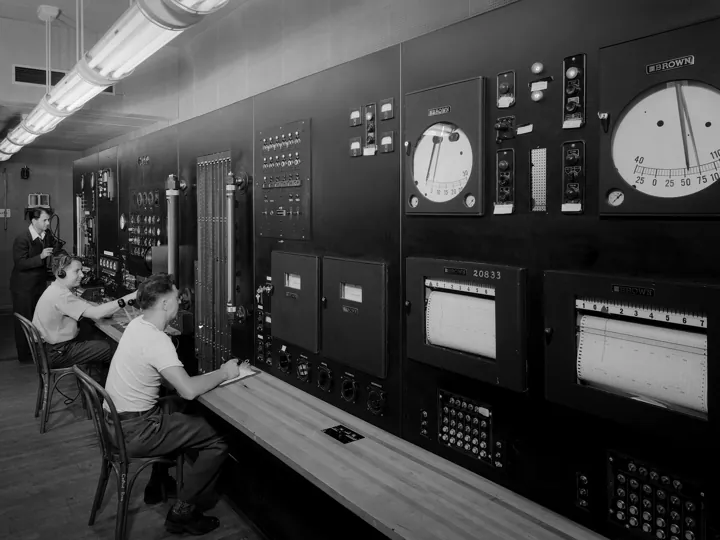
- Description
- Salle de contrôle d'une soufflerie : mur de cadrans, de voyants et d'enregistreurs à papier, surveillé par des opérateurs.
- Source
- NASA (Aircraft Engine Research Laboratory) · original page
- Licence
- PD Public domain
 Observability and Reliability
This theme measures the ability to know what software is doing in production, detect degradation before users do, and restore it quickly. Commitments are expressed as detection time…
In brief
This theme measures the ability to know what software is doing in production, detect degradation before users do, and restore it quickly. Commitments are expressed as detection time, restoration time, and quantified service level objectives (SLOs). Monitoring of data pipelines is detailed on the BI 10 and Data 10 sides.
Level: 🟢→🔴 · Theme code: OBS (DL matrix)
Why this theme#
“The user is the one who alerts us” is the sign of a blind spot. Every minute between an outage and its detection is a minute of invisible incident, decisions made on bad data, and lost trust. Conversely, over-alerting is exhausting: a team that receives 200 alerts a day handles none of them. Reliability is therefore a measured balance between speed of change and stability, which the SRE (Site Reliability Engineering) approach formalizes through SLOs and the error budget.
Observability differs from simple monitoring: monitoring means checking expected questions (“is the service responding?”); observing means being able to ask unexpected questions based on rich signals (structured logs, metrics, correlated traces). The open standard OpenTelemetry provides a common vocabulary for these signals.
In a datamart, a nightly process can technically “succeed” with wrong numbers: reliability includes data freshness and accuracy, not just availability. See 08 BI — Testing and Metrics Reliability.
What the theme measures#
- Axis: from “we discover outages through complaints” to “service objectives drive change decisions”.
- Key indicators: mean time to detect (MTTD); restoration time; share of incidents detected by monitoring rather than by users; SLO compliance; alert noise (non-actionable alerts).
- Unit: minutes; %; alerts per week and per on-call person.
Five-level table#
| Level | Short name | Commitment | Typical indicator (orders of magnitude) |
|---|---|---|---|
| 1 | Blind | An outage is known when a user reports it. | Detection by users > 80% |
| 2 | Monitored | Clear outages (service down, disk full) are detected before users. | Detection < 30 min for clear outages |
| 3 | Diagnosed | When facing an incident, the cause is found in minutes thanks to correlated logs and metrics. | Structured logs; diagnosis < 1 h |
| 4 | Objective-driven | Quantified service objectives exist; when the error budget is consumed, changes are slowed down. | SLO per service; alerts on budget consumption; > 90% actionable alerts |
| 5 | Resilient | The system absorbs partial failures without visible impact, and every incident improves the system. | Contained failures; chaos exercises; measured learning |
Milestones by level#
| ID | Milestone | Verifiable evidence |
|---|---|---|
| DL-OBS-1.1 | Application errors are logged somewhere accessible | Log accessible to the team |
| DL-OBS-1.2 | Incidents are recorded (date, impact, cause, action) | Incident register |
| DL-OBS-1.3 | A person or channel is identified to receive reports | Known entry point |
| DL-OBS-2.1 | Automated health checks cover availability, disk space, scheduled jobs | Test alerts received |
| DL-OBS-2.2 | Alerts reach an identified person (on-call or role) | On-call schedule |
| DL-OBS-2.3 | A scheduled job that did not run (or did not complete) triggers an alert | Test by stopping a job |
| DL-OBS-2.4 | Alerts have handling guidance (what to do) | Action sheets for the 10 most frequent alerts |
| DL-OBS-3.1 | Logs are structured, timestamped in the same format, and carry a correlation ID | End-to-end transaction reconstruction |
| DL-OBS-3.2 | Service metrics (latency, error rate, saturation, traffic) are available | Dashboard per service |
| DL-OBS-3.3 | Detection and restoration times are measured per incident | Mean and median over 6 months |
| DL-OBS-3.4 | A blameless post-incident analysis is conducted for major incidents | Dated reports with actions |
| DL-OBS-3.5 | Freshness and volume of produced data are monitored (row count, last update date) | Alert on stale data |
| DL-OBS-4.1 | Quantified SLIs (indicators) and SLOs (objectives) exist for each critical service | Document validated by the business |
| DL-OBS-4.2 | The error budget is tracked; its consumption changes the pace of changes | Documented freeze/restart decision |
| DL-OBS-4.3 | Alerts target symptoms (user impact) rather than isolated causes | Alert catalog review |
| DL-OBS-4.4 | > 90% of triggered alerts are actionable (quarterly noise review) | Measured rate |
| DL-OBS-4.5 | Distributed tracing or equivalents cover critical paths | Complete trace of a path |
| DL-OBS-5.1 | Recovery mechanisms (automatic retry, queues, idempotency) absorb partial failures | Dependency failure test |
| DL-OBS-5.2 | Scheduled failure exercises (chaos, recovery days) take place at least twice a year | Reports |
| DL-OBS-5.3 | Actions resulting from incidents are closed within a defined timeframe (> 80% within 30 days) | Action tracking |
| DL-OBS-5.4 | The cost of observability (telemetry volume) is managed without losing signal | Sampling and retention policy |
Detailed reading by level#
🟢 Level 1 — Blind#
- Signs: “we found out from the client”; logs in files nobody looks at.
- Gain: zero cost.
- Does not guarantee: neither detection nor learning.
- Difficulty: 1/5 · Effort: 1/5.
🟢 Level 2 — Monitored#
- Signs: health checks, alerts to an owner, detection of jobs that did not run (silence is a signal: absence of success must trigger an alert).
- Gain: clear outages no longer go unnoticed overnight.
- Does not guarantee: diagnosis or detection of subtle degradations.
- Difficulty: 2/5 · Effort: 2/5.
🟡 Level 3 — Diagnosed#
- Signs: structured logs with correlation ID, service metrics (the “four golden signals”: latency, traffic, errors, saturation), post-incident analyses.
- Gain: diagnosis time drops from days to minutes; incident memory accumulates.
- Does not guarantee: that alert priority reflects business impact.
- Difficulty: 3/5 · Effort: 3/5.
🔴 Level 4 — Objective-driven#
- Signs: for example, an SLO of 99.5% of nightly jobs completed before 6 AM over 30 days leaves an error budget of about 3.6 h (0.5% of 720 h) — order of magnitude; if the budget is consumed, priority shifts from features to reliability. Alerts speak in terms of impact (“morning reports will not be ready”), not isolated causes.
- Gain: a common language between product and operations, explicit trade-offs.
- Does not guarantee: that the objective is the right one — an SLO is revised based on real usage.
- Difficulty: 4/5 · Effort: 4/5.
🔴 Level 5 — Resilient#
- Signs: partial failures are absorbed (idempotent retries, buffer queues), failure exercises are routine, incident actions are closed.
- Gain: the system and team learn faster than failures occur.
- Does not guarantee: absence of a major incident; it reduces impact and duration.
- Difficulty: 5/5 · Effort: 5/5.
Partial attainment and rating#
Apply the rating rule.
- 0.5 on DL-OBS-3.1: structured logs for the application, free text for scheduled scripts.
- 0.5 on DL-OBS-4.1: SLOs defined, never reviewed or linked to a decision.
- A partial 5: yearly failure exercises and closed actions, but telemetry cost not managed.
Alert fatigue. Symptom: alerts are ignored or muted. Cause: alerts on causes, without an actionable threshold. Remedy: an alert must call for immediate human action; otherwise, it is a dashboard or report.
Technical success, business failure. Symptom: the job is “green,” the numbers are stale or half-loaded. Cause: execution is monitored, not produced data. Remedy: check freshness, volume, and invariants (cross totals) after each load.
Alert on the absence of a success signal (dead man's switch): this is the only way to detect that the scheduler itself has gone down.
Move to the next level#
Possible means (optional)
- 1 → 2: health checks, alert on failure and on missing execution, named on-call.
- 2 → 3: structured logging with correlation, service metrics, post-incident analyses.
- 3 → 4: define one SLO per critical service with the business, track the budget, remove any non-actionable alert.
- 4 → 5: idempotent retries, failure exercises, systematic closure of actions.
Nightly consolidation job: at level 1, you find out at 9 AM that reports are empty. At level 3, a 6 AM alert states “SFA batch load incomplete: 41% of expected rows” thanks to a volume check, with batch ID to find the cause in 10 minutes.
A low MTTR target encourages quick closure without fixing the cause. Pair it with the incident recurrence rate.
See also#
- Neighbors: 06 Deployment and Operations · 11 Performance and Scalability · 09 Technical Debt and Maintainability · 07 Security.
- Other matrices: BI — Operations, Monitoring, and Capacity · Data — Operations and Support · Data — Data Quality.
- Practice: CI/CD · Project Metrics and Reporting · Project Management Pitfalls and Best Practices (Cross-Cutting Summary).
- Glossary · Rating.
✻ Written by Claude Sonnet 5.5
