

- Description
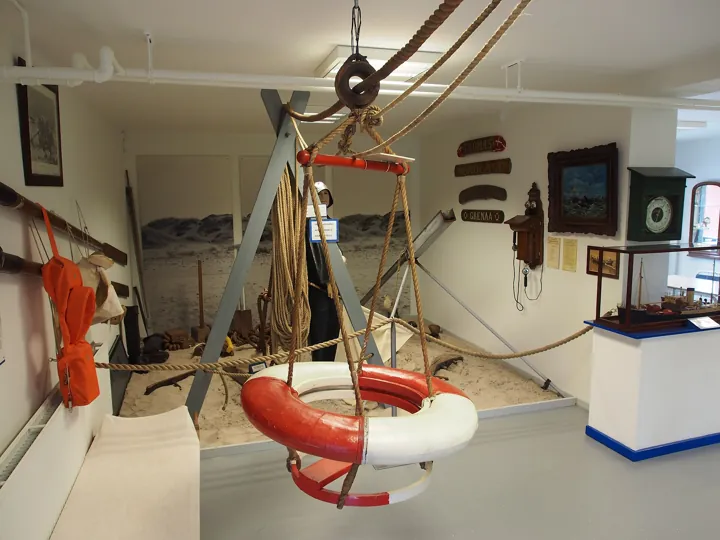
- Bouée de sauvetage suspendue à un portique de corde dans un musée de sauvetage en mer : le secours prêt à servir
- Source
- Alf van Beem · original page
- Licence
- CC0 Public domain
 Operations and Support
Once delivered, a data product enters its longest phase of life: every night, a load must succeed; every morning, users expect fresh numbers. Data failures are…
Level: 🟢→🔴 · Theme code: EXP
Why this theme#
Once delivered, a data product enters its longest phase of life: every night, a load must succeed; every morning, users expect fresh numbers. Data failures have an unpleasant property: they are often silent (processing succeeds, but with partial or stale data). Immature operations become obvious at the first call: if it's the user who alerts the team, monitoring has failed. This theme covers data monitoring (not just server availability), incident management, support, and continuity. It complements the DL matrix — observability and reliability and the BI matrix — operations, monitoring, and capacity, on the reporting side. Here, the focus is on delivering a reliable data service.
What this theme measures#
- Axis: from on-demand intervention to continuous improvement driven by recurring issues.
- Key indicator: share of data incidents detected before the user and compliance with data SLAs (freshness, availability, resolution time).
- Unit: % of incidents detected internally; % of days where freshness is met; mean time to detect, to resolve; number of recurring incidents.
The five levels#
| Level | Short name | Promise | Typical indicator (orders of magnitude) |
|---|---|---|---|
| 1 | Firefighter | When a failure is reported, someone handles it; timing depends on individuals. | Detection by users; resolution in days |
| 2 | Monitored | A load failure is visible to the team in the morning, and they notify users. | Processing status checked daily |
| 3 | Organized | Incidents are categorized, prioritized, and handled within target timelines; operations procedures are documented. | Target resolution time by priority; queued support |
| 4 | Committed | Data SLAs are measured and met; alerts come before complaints; every major incident gets a review and actions. | ≥ 90% of incidents detected internally; freshness met on ≥ 95% of days |
| 5 | Self-healing | Common failures recover automatically; recurring issues are eliminated; capacity is anticipated. | Recurrences close to 0; rare manual interventions |
Milestones by level#
| ID | Milestone | Verifiable evidence |
|---|---|---|
| PD-EXP-1.1 | Scheduled processes are listed with their timing and owner. | Operations calendar. |
| PD-EXP-1.2 | A processing log records start, end, status, and errors. | Viewable log table or file. |
| PD-EXP-1.3 | A single entry point receives support requests. | Mailbox or ticketing tool. |
| PD-EXP-1.4 | Regular backup is in place. | Backup history. |
| PD-EXP-2.1 | A processing failure triggers a notification to the team. | Test: a simulated failure generates a message. |
| PD-EXP-2.2 | Every morning, load status is checked (by a person or a dashboard). | Daily verification trace. |
| PD-EXP-2.3 | Users are notified when data is delayed. | Message or freshness banner in the report. |
| PD-EXP-2.4 | The last refresh date is visible in every report. | Freshness indicator present. |
| PD-EXP-3.1 | Incidents are categorized (load failure, incorrect data, access, performance) and prioritized. | Priority grid and classified tickets. |
| PD-EXP-3.2 | Target handling times exist by priority. | Support SLA document and compliance stats. |
| PD-EXP-3.3 | Written operations procedures (restart, recovery, replay) can be used by a third party. | Procedure executed by a non-author without help. |
| PD-EXP-3.4 | On-call duty or coverage is defined for critical processes. | On-call schedule, or written recovery rule. |
| PD-EXP-4.1 | Data SLAs (freshness, completeness) are measured automatically and published (QUA). | SLA compliance dashboard over ≥ 3 months. |
| PD-EXP-4.2 | Proactive alerts (abnormal volume, delay, drift) come before complaints. | Cases where the alert went out before the user complaint. |
| PD-EXP-4.3 | Each major incident leads to a blameless review with tracked actions. | Meeting notes and action status. |
| PD-EXP-4.4 | Disaster recovery (full restore) has been tested. | Restore drill with measured duration. |
| PD-EXP-5.1 | Common failures trigger safe automatic recovery (restart, replay). | Automatic recoveries logged without intervention. |
| PD-EXP-5.2 | Recurring problems are eliminated at the root, not just handled. | Trend of incident count by cause. |
| PD-EXP-5.3 | Capacity (volumes, load window) is anticipated and planned. | 12-month load window forecast. |
| PD-EXP-5.4 | Manual intervention time per product is measured and decreasing. | Metric tracked over ≥ 3 quarters. |
Detailed reading by level#
🟢 Level 1 — Firefighter#
- Signs: “the numbers aren't up to date” arrives at 9 a.m.; people hunt for the error in unreadable logs; recoveries are improvised.
- Gain: heroic responsiveness.
- Does not guarantee: the duration of the next outage or dependency on one person.
- Difficulty: 1/5 · Effort: 1/5.
🟢 Level 2 — Monitored#
- Signs: failure alerting; a “data up to date as of…” banner; users are informed by the team before their day starts.
- Gain: visible failures stop being surprises.
- Does not guarantee: detection of silent failures (processing succeeds, partial data).
- Difficulty: 2/5 · Effort: 2/5.
🟡 Level 3 — Organized#
- Signs: categorized tickets; procedures usable by a third party; target timelines by priority; defined coverage.
- Gain: service survives absences; users know what to expect.
- Does not guarantee: that timelines are met or that failures are prevented.
- Difficulty: 3/5 · Effort: 3/5.
🟡 Level 4 — Committed#
- Signs: measured freshness SLAs; volume alerts; blameless reviews; restore drill completed.
- Gain: operations that can be demonstrated and improved.
- Does not guarantee: elimination of root causes (failures are handled well, but they return).
- Difficulty: 4/5 · Effort: 4/5.
-- Contrôle de fraîcheur et de volume après chargement (T-SQL) : détecte la panne « silencieuse »
SELECT 'Releve' AS Objet,
       MAX([date])                        AS DerniereDate,
       COUNT(*)                           AS NbLignesJour,
       CASE WHEN MAX([date]) < CAST(GETDATE() AS date)              THEN 'RETARD'
            WHEN COUNT(*) < 0.5 * (SELECT AVG(N) FROM [exp].[VolumeJ7]) THEN 'VOLUME_ANORMAL'
            ELSE 'OK' END                 AS Statut
FROM   [fact].[Releve] WITH (NOLOCK)
WHERE  [date] = CAST(GETDATE() AS date);   -- sur un chargement de nuit, ajustez la date de référence
One night, meter-reading load “succeeds” but the source application was under maintenance: 6% of usual volume, so incorrect totals in the morning. Level 2: no alert (processing is green). Level 4: the rule “volume < 50% of the average of the last 7 days” blocks publication and notifies the team at 6:10 a.m., and they inform users before 8 a.m. Level 4 cost: one query and one reference volume table.
🔴 Level 5 — Self-healing#
- Signs: safe recoveries run on their own; each recurring cause is removed; the load window is planned 12 months out.
- Gain: reduced on-call workload; a team that builds instead of repairing.
- Does not guarantee: absence of rare, complex incidents; automation can also hide an underlying issue (restarting without understanding).
- Difficulty: 5/5 · Effort: 5/5.
Partial achievement and rating#
Assess over the last three months of incidents: a milestone is worth 1 if the practice was applied to all, 0.5 to most, 0 otherwise. For PD-EXP-4.2, count actual incidents where the alert preceded the complaint, in a log (QUA PD-QUA-1.1).
A “partial 5”: three automatic recoveries are working (5.1 at 0.5), recurring incidents were cut in half (5.2 at 0.5), capacity is tracked without forecasting (5.3 at 0.5), manual time is not measured (5.4 at 0).
Infrastructure monitoring without data monitoring: the server is green, processing is green, numbers are wrong. Remedy: monitor freshness, volume, and distribution, i.e., data properties.
Restarting that hides issues: restart until it passes without looking for the cause. Symptom: an incident “resolved” three times a week. Remedy: count restarts as incidents and require a cause.
Move to the next level#
Possible means (optional)
| Transition | Possible levers |
|---|---|
| 1 → 2 | A single processing log; failure notification; a freshness indicator in reports. |
| 2 → 3 | A priority grid; procedures tested by a third party; a coverage schedule. |
| 3 → 4 | Volume and freshness checks; blameless reviews; restore drill (see DOP). |
| 4 → 5 | Automatic idempotent recoveries; monthly review of recurring causes; capacity forecasting. |
Cross-cutting pitfalls: (1) False positive — SLA met on too narrow a scope (a single process); verify coverage. (2) Goodhart — aiming for “zero incidents” leads to no longer reporting them; measure detection, not count. (3) Hero — operations relying on one person have not moved beyond level 1, regardless of that person's quality.
Useful for summarizing an error log, proposing a diagnosis, drafting an incident review, detecting volume anomalies. Guardrails: AI does not modify production without validation; its diagnoses are hypotheses; do not send it personal data from logs (SEC).
See also#
- Same matrix: 03 Quality · 06 DataOps · 11 Cost and Value · 12 Metadata · README
- Other matrices: DL — Deployment and Operations · DL — Observability and Reliability · BI — Operations, Monitoring, and Capacity · PI — Delivery and Production Release
- Practice: CI/CD for Data: Databases, Datamarts, Pipelines, and Reports · SQL Server in SaaS — Challenges and Pitfalls · OneLake + SaaS Mobile Apps: Challenges and Pitfalls · Project Metrics and Reporting
- Glossary · Rating: How to Read Scores, Ratings, and Legend
✻ Written by Claude Sonnet 5.5
