

- Description
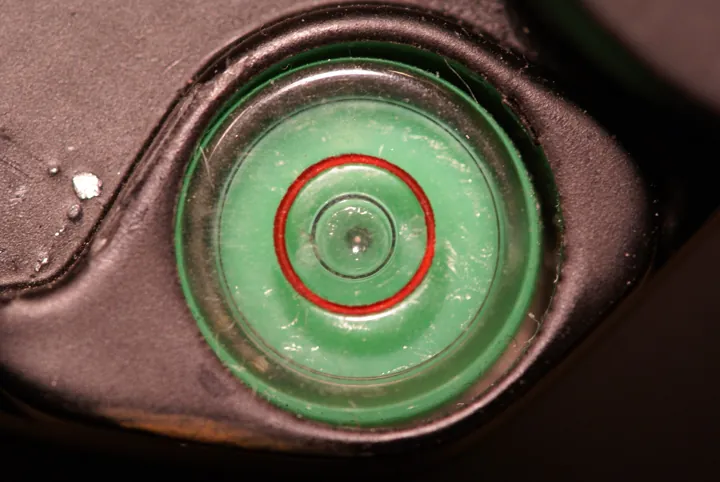
- Niveau à bulle circulaire dont la bulle centrée dans le cercle rouge indique que tout est d'aplomb.
- Source
- Dmeranda · original page
- Licence
- PD Public domain
 Self-Assessment with Maturity Matrices
You will be able to run a team self-assessment, step by step, on one of the four matrices: prepare, collect evidence, rate, calibrate, weight, report back.
In brief
- You will be able to run, step by step, a team self-assessment on one of the four matrices: prepare, collect evidence, rate, calibrate, weight, report back.
- You will have a reusable grid template (Markdown tables) for each matrix, with the real theme codes.
- You will be able to facilitate a 2-hour workshop, avoid score drift (Goodhart's law), and turn the gap between current state and target into a progress plan.
- A complete numerical example based on a fictional six-person BI/datamart team illustrates every calculation, all the way through to text-described radar reporting.
Level: 🟢→🔴
Principles and preparation#
🟢 Novice. A self-assessment answers one question only: “where are we really, and which two or three milestones do we want to achieve before next time?” It does not rank people, and it does not produce a grade for management: it is used to decide where to invest. If you have not read the principle of matrices and the rating rule, start there.
Four principles govern the method:
- Evidence, not statements. A milestone only reaches 1 if the evidence was seen during the workshop. Without evidence, it is capped at 0.5.
- A precise scope. One team, one product, one period. “All of IT” is not a scope.
- Compare to yourselves. The assessment is repeated every 6 to 12 months, always in the same way.
- Assess each fact only once, in the matrix that owns it (see overlaps).
🟡 Practice — choosing your matrix and scope.
| If the challenge is… | Start with | Duration of a first pass |
|---|---|---|
| A project going off track (timelines, budget, people) | PI | Half-day |
| Risky releases, fragile code | DL | 2 hrs per block of 4 themes |
| Disputed numbers, unstable data | PD | 90 min for a broad first pass |
| A slow, fragile, or untested Power BI product | BI | 2 hrs |
Do not rate all four matrices at once the first time: one matrix only, one product only, one two-hour workshop. Initial scores are always less precise than those in the second cycle; the essential point is to establish the baseline.
Preparation (one week before). Appoint a facilitator who does not rate their own scope (or a peer from another team), assemble an evidence package (links to pipelines, test reports, logs, repositories, capacity dashboards), and invite 4 to 8 people covering the roles (development, operations, business, steering). Send the selected theme pages in advance.
The step-by-step method#
🟡 Practice. Seven steps, from preparation to follow-up.
| # | Step | Output | Estimated duration |
|---|---|---|---|
| 1 | Scope: matrix, scope, period, selected themes | One scope sentence | 15 min |
| 2 | Gather evidence by theme | Evidence package | 1 to 3 hrs outside workshop |
| 3 | Rate milestones one by one (0 / 0.5 / 1), evidence seen | Completed grid | Workshop |
| 4 | Calculate: acquired level, theme score, matrix score | Scores | 15 min |
| 5 | Calibrate: compare opinions, review gaps > 0.5 | Consolidated grid | Workshop |
| 6 | Decide: targets by theme, 2 to 3 milestones to achieve | Progress plan | 30 min |
| 7 | Follow up: mid-course review, new assessment at 6–12 months | Score history | Recurring |
Theme calculation, in pseudo-algorithm (faithful to the common rule):
for N from 1 to 5:
    J(1..N) = all milestones from levels 1 to N
    if average(progress of J(1..N)) >= 0.8 AND min(progress of J(1..N)) > 0 :
        N_acquired = N
    else: stop
theme_score = N_acquired + average(progress of milestones at level N_acquired+1) × 0.99
Symptom: a theme shows N_acquired = 3 while one level-2 milestone is at 0. Cause: the average was calculated on level 3 only. Fix: the average must cover all milestones from levels 1 to N, and a zero is blocking at any lower level.
The same calculation in PowerShell, useful for automating consolidation of a grid exported to CSV (one row per milestone, columns Theme, Level, Progress):
function Get-ScoreTheme {
    param([Parameter(Mandatory)][object[]]$Jalons)   # objets avec Niveau (1..5) et Avancement (0, 0.5, 1)
    $acquis = 0
    foreach ($n in 1..5) {
        $jusquaN = $Jalons | Where-Object { [int]$_.Niveau -le $n }
        if (-not $jusquaN) { break }
        $moy = ($jusquaN | Measure-Object -Property Avancement -Average).Average
        $min = ($jusquaN | Measure-Object -Property Avancement -Minimum).Minimum
        if ($moy -ge 0.8 -and $min -gt 0) { $acquis = $n } else { break }
    }
    $suivants = $Jalons | Where-Object { [int]$_.Niveau -eq ($acquis + 1) }
    $partiel  = if ($suivants) { ($suivants | Measure-Object -Property Avancement -Average).Average * 0.99 } else { 0 }
    [math]::Round($acquis + $partiel, 2)
}
# Avancement doit être lu en décimal invariant : [double]::Parse($txt, [cultureinfo]::InvariantCulture)
Always read progress values using invariant culture: on a machine set to French locale, 0,5 and 0.5 are not interpreted the same way depending on the tool, and a silently wrong average is worse than an error.
Grid templates#
🟡 Practice. Two templates: the milestone-level grid (the workshop work), identical for all matrices, and the theme-level grid (the summary), with each matrix's codes. Copy them into a workbook or a Markdown file tracked in your repository, alongside the assessment history.
Milestone-level grid (single template)#
IDs and labels can be read on the theme page (section “Milestones by level”); only the last row for each theme below must be filled in.
| Milestone ID | Milestone (summary) | Observed evidence (link, date) | Progress (0 / 0.5 / 1) | Comment, potential disagreement |
|---|---|---|---|---|
<MATRICE>-<THÈME>-1.1 |
||||
<MATRICE>-<THÈME>-1.2 |
||||
… |
||||
<MATRICE>-<THÈME>-5.n |
Theme result, to be completed below the table: cumulative average at levels 1…5, milestone(s) at 0, N_acquired, average at next level, score.
Theme-level grid — PI, IT project#
| Theme | Code | Weight | N_acquired | Avg. lvl. N+1 | Score | Target | Main evidence |
|---|---|---|---|---|---|---|---|
| Scoping and Vision | CAD |
1 | |||||
| Governance and Steering | GOU |
1 | |||||
| Planning and Estimation | PLA |
1 | |||||
| Scope and Requirements Management | PER |
1 | |||||
| Risk Management | RSK |
1 | |||||
| Team and Collaboration | EQU |
1 | |||||
| Stakeholders and Communication | PAR |
1 | |||||
| Quality and Acceptance | QUA |
1 | |||||
| Delivery and Production Release | LIV |
1 | |||||
| Continuous Improvement and Learning | AMC |
1 | |||||
| Budget, Value, and Benefits | VAL |
1 | |||||
| Matrix (weighted average) | Σ = |
Grid by theme — SD, software development#
| Theme | Code | Weight | N_acquired | Avg. level N+1 | Score | Target | Main evidence |
|---|---|---|---|---|---|---|---|
| Architecture and Design | ARC |
1 | |||||
| Code Quality | COD |
1 | |||||
| Testing | TST |
1 | |||||
| Version Control and Branching | GIT |
1 | |||||
| Continuous Integration and Delivery | CIC |
1 | |||||
| Deployment and Operations | DEP |
1 | |||||
| Security | SEC |
1 | |||||
| Observability and Reliability | OBS |
1 | |||||
| Technical Debt and Maintainability | DTT |
1 | |||||
| Documentation and Knowledge Transfer | DOC |
1 | |||||
| Performance and Scalability | PRF |
1 | |||||
| Developer Experience and Flow | DXF |
1 | |||||
| Matrix (weighted average) | Σ = |
Grid by theme — DP, data project management#
| Theme | Code | Weight | N_acquired | Avg. level N+1 | Score | Target | Main evidence |
|---|---|---|---|---|---|---|---|
| Scoping, Value, and Use Cases | VAL |
1 | |||||
| Governance and Organization | GOV |
1 | |||||
| Data Quality | QUA |
1 | |||||
| Data Sources and Data Contracts | CTR |
1 | |||||
| Modeling and Architecture | MOD |
1 | |||||
| Lead Time and DataOps | DOP |
1 | |||||
| UAT and Business Validation | REC |
1 | |||||
| Security, Privacy, and Compliance | SEC |
1 | |||||
| Adoption and Change | ADO |
1 | |||||
| Operations and Support | EXP |
1 | |||||
| Cost and Value Management (Data FinOps) | FIN |
1 | |||||
| Metadata, Lineage, and Documentation | MET |
1 | |||||
| Matrix (weighted average) | Σ = |
Grid by theme — BI, BI development#
| Theme | Code | Weight | N_acquired | Avg. level N+1 | Score | Target | Main evidence |
|---|---|---|---|---|---|---|---|
| Semantic Model | MOD |
1 | |||||
| Data Layer and ETL | ETL |
1 | |||||
| Performance and Data Volume | PRF |
1 | |||||
| Visualization and UX | VIZ |
1 | |||||
| DAX Measures and Calculations | DAX |
1 | |||||
| RLS Security and Access | RLS |
1 | |||||
| Report Versioning and Industrialization | IND |
1 | |||||
| Testing and Metrics Reliability | TST |
1 | |||||
| Governance, Catalog, and Self-Service | GOV |
1 | |||||
| Operations, Monitoring, and Capacity | OPS |
1 | |||||
| Accessibility and Multilingual Support | ACC |
1 | |||||
| Cost, Licensing, and Capacity | CST |
1 | |||||
| Matrix (weighted average) | Σ = |
Symptom: confusion between BI-TST and DL-TST, PD-MOD and BI-MOD, PD-QUA and PI-QUA. Cause: theme codes are repeated from one matrix to another. Remedy: always cite the matrix prefix in reports and tickets (BI-TST-3.1, never TST-3.1).
2-hour workshop#
🟡 Hands-on. Framework for a team of 4 to 8 people, on a 12-theme matrix (only the 4 to 6 themes selected during the scoping step are rated in detail; the others are rated “roughly” in one minute).
| Time | Duration | Sequence | Output |
|---|---|---|---|
| 0:00 | 10 min | Ground rules: evidence, scope, no ranking of people, reminder of the rating rule | Agreement on the method |
| 0:10 | 15 min | Silent reading of each level’s promise for the first theme | Each person privately notes their perceived level |
| 0:25 | 60 min | Milestone rating theme by theme (4 to 6 themes, ~10–15 min each): everyone votes 0 / 0.5 / 1 at the same time, evidence is shown, a decision is made | Completed grid |
| 1:25 | 15 min | Calculation live and profile reading (sawtooth patterns, milestones at 0) | Scores by theme |
| 1:40 | 15 min | Targets: one target level per theme, based on risk and size | “Target” column |
| 1:55 | 5 min | Selection of 2 to 3 milestones to achieve, with owner and due date for each | Commitments |
Facilitation rules:
- Simultaneous voting (cards, blind round-robin) before discussion, to avoid anchoring on the most senior person’s opinion.
- Disagreements are data: a half-point gap on a milestone is resolved with evidence; a one-point gap signals that two people are not talking about the same scope.
- Parking lot: anything that looks like a remediation effort is recorded for the “Decide” step, not handled during the session.
- Prohibited: linking scores to individual evaluation, projecting scores from other teams, discussing tools before rating (milestones focus on outcomes, not products).
Start with the theme the team is most comfortable with: the workshop finds its rhythm and participants understand the evidence mechanism before tackling sensitive themes.
Calibration Between Evaluators#
🔴 Expert. Two honest evaluators differ by half a point on a milestone: this is the residual subjectivity stated in each matrix README. Calibration makes it stable and comparable from one cycle to the next.
- Anchor benchmark. Before the first evaluation, jointly choose three milestones for which you agree on what 0, 0.5, and 1 mean, with a concrete example of each (“0: no evidence; 0.5: the practice exists but has not been applied to the last two batches; 1: applied to every delivery of the quarter, evidence observed”). Record them; they are the reference for subsequent cycles.
- Double rating. Two people rate the same theme separately (one from the team, the other from a neighboring team), then compare. The average gap observed should narrow from one cycle to the next.
- Evidence sampling. For each theme, thoroughly verify one random piece of evidence (trace back from the dashboard to the event). One false piece of evidence downgrades all milestones in the theme rated on that same basis.
- Doubt rule. In case of persistent disagreement, keep the lower score and note the doubt; do not average two opposing opinions.
- Traceability. Keep the grid for each cycle (date, participants, evidence): history is the only legitimate basis for comparison.
Useful indicator: the gap rate — share of milestones for which two evaluators differ by at least 0.5. A fair order of magnitude for a first cycle is one milestone out of four or five (expert benchmark, not measured by a survey); after two calibration cycles, the reasonable goal is to cut it in half.
Symptom: the score rises by 0.8 from one cycle to the next with no visible change in the work. Cause: benchmark drift (you are more lenient, or the person rating has changed). Remedy: reread the three anchor milestones at the start of each cycle and rerate the previous cycle with the new evaluator team on a control theme.
Weighting#
🟡 Practical. The matrix score is a weighted average: default weight is 1, editable. Weighting is used to reflect the risk and stakes of the context, not to make the result look better.
| Situation | Themes to weight upward | Suggested weight | Justification |
|---|---|---|---|
| Reports used for regulatory or financial decisions | Acceptance testing and tests (PD-REC, BI-TST), security (BI-RLS, PD-SEC) |
2 | The cost of a wrong number or a leak is high |
| Product delivered to many clients in kits | Delivery and deployment (DL-DEP, PI-LIV), source contracts (PD-CTR) |
2 | A failed delivery is multiplied by the number of clients |
| Young team, high turnover | Documentation, team (DL-DOC, PI-EQU), metadata (PD-MET) |
1.5 to 2 | Knowledge must survive departures |
| Stable product in maintenance | Technical debt (DL-DTT), operations (PD-EXP) |
1.5 | The cost is over time |
| Prototype or short-lifespan product | Several themes at 0 (removed from scope) | 0 | A non-applicable theme is not “bad”: it is explicitly excluded |
Good usage rules:
- Set weights before rating, never after: changing a weight afterward to improve the average is a form of cheating yourself.
- Document each weight with one sentence of justification (“Weight” column of the grid + comment).
- Compare with constant weights from one cycle to the next; if weights change, publish both calculations.
- Weight 0 = out of scope, must be justified, not used to hide a weakness.
The formula: score_matrice = Σ(poids × score_thème) / Σ(poids).
Progress Plan#
🟡 Practical. Evaluation has value only if it leads to a few well-chosen decisions. Five-step method.
- Gap = target − score, theme by theme. Sort by descending gap, then weight by the weight.
- Filter by dependencies. Do not address a theme whose prerequisite theme is insufficient (see dependency graphs in each README: for example tests before continuous delivery). Prioritize the upstream link.
- Choose milestones, not themes. Keep 2 to 3 milestones from level N_acquired+1 of 2 to 3 themes. A milestone is a verifiable deliverable; a theme is a domain.
- Estimate cost and benefit using the difficulty and effort ratings /5 given on the theme page (expert assessments, to be adapted). Favor milestones with low effort and high impact.
- Commit: one owner, one deadline, expected evidence, one mid-point review date.
The “possible means” listed on each theme page are optional: a milestone is satisfied by any means that produces the evidence. For the practices themselves, see for example CI/CD: Continuous Integration and Delivery, CI/CD for Data: Databases, Datamarts, Pipelines, and Reports, Branching Strategies and Project Metrics and Reporting.
Plan these milestones like regular work: tickets in the backlog, estimated, reviewed, with a definition of done (the evidence). A progress plan that lives alongside the backlog dies at the second emergency.
Team at BI-TST 1.2 and BI-IND 1.7. Testing comes before industrialization: the plan keeps first two level-2 BI-TST milestones (a documented set of manual checks; a documented monthly reconciliation between one report number and the source), then one level-2 BI-IND milestone (projects in repository with history). Level-3 BI-IND milestones wait until BI-TST reaches 2.5.
Measurement Gaming and Goodhart’s Law#
🔴 Expert. Goodhart’s law (when a measure becomes a target, it stops being a good measure) is the main threat to a maturity framework. Each matrix mentions it; here are typical forms of gaming and their countermeasures.
| Gaming | Example in a BI/datamart context | Countermeasure |
|---|---|---|
| Cosmetic | A “risk register” filled in the day before the evaluation | Ask for the update history and resulting decisions |
| Indicator inflation | High test coverage through tests with no assertions | Sample tests, read one random test, measure escaped defects |
| Strategic rating | Each team rates itself 1 everywhere to get budget, or 3 everywhere to be “within the norm” | Evidence reviewed, double rating, no link between score and individual budget |
| Score chasing | Aiming for level 4 on all themes although risk does not justify it | Target by theme, documented weights |
| Rule circumvention | Re-splitting a level-0 milestone into three level-1 milestones to pass the threshold | Milestones are fixed by the theme page; they are not changed during the session |
| Punitive evaluation | Scores are used to evaluate people | Written charter: the matrix evaluates practices, never individuals |
Defense principles:
- Evidence before score, evidence sampling at each cycle.
- Outcome before practice: when a practice is checked but the outcome remains poor (incidents, disputed numbers), the outcome prevails and the milestone is reopened.
- Adverse indicators: pair a volume indicator with a quality indicator (deployment frequency with failure rate; number of tests with escaped defects).
- Rotation of evaluators and samples.
- Score governance: the score is never a contractual objective; only the milestone plan is binding.
Complete numerical example#
🟡 Practical. Fictitious and anonymous context: “the Atlas team,” six people (four BI/datamart developers, one operator, one business point person), maintaining a SQL Server datamart fed by a field sales force application and about fifteen multilingual Power BI reports, versioned in TFVC and delivered as installation kits to about a dozen clients. Selected matrix: BI (12 themes). Period: the last twelve months. 2-hour workshop, with a peer from another team as observer.
Step 1 — One theme in detail: BI-TST (testing and metrics reliability)#
The milestones are those from the official theme page (levels 1 to 3; levels 4 and 5 are not included in the calculation as long as level 3 has not been achieved). Only the progress ratings and the observed evidence are fictitious.
| Milestone | Title (theme page) | Observed evidence at Atlas | Progress |
|---|---|---|---|
| BI-TST-1.1 | The author compares at least one total against the source | Control trace in each delivery ticket | 1 |
| BI-TST-1.2 | A business user reviewed the report before publication | Review mention by the business point person | 1 |
| BI-TST-1.3 | Known variances are formally acknowledged in writing | Up-to-date list of known variances | 1 |
| BI-TST-2.1 | Acceptance testing checklist per report (totals, filters, boundary periods) | Checklist filled out for 12 out of 15 reports | 1 |
| BI-TST-2.2 | Control data has a source of truth (SQL query, reference extract) | Reference queries kept for 5 facts out of 10 | 0,5 |
| BI-TST-2.3 | Explicit tolerated variances (rounding, time zone, period close) | Written threshold for 3 measures out of 10 | 0,5 |
| BI-TST-2.4 | Business acceptance testing signed off before production go-live | Signed validation for each kit | 1 |
| BI-TST-3.1 | Test DAX queries stored in repository (one per key measure) | No versioned .dax file |
0 |
| BI-TST-3.2 | Expected values come from independent SQL, not from the measure | Done manually for 2 measures out of 10 | 0,5 |
| BI-TST-3.3 | Stable reference dataset (frozen or snapshot) | Test database refreshed manually, undocumented | 0,5 |
| BI-TST-3.4 | Edge cases tested (empty period, total, start/end of year, nulls) | Tested only on main reports | 0,5 |
| BI-TST-3.5 | Best Practice Analyzer run regularly | Run twice in the year | 0,5 |
Calculation:
- Levels 1 and 2: sum = 3 + (1 + 0,5 + 0,5 + 1) = 6 for 7 milestones → average = 0,857 ≥ 0,8, no zeroes → level 2 achieved.
- Levels 1 to 3: sum = 6 + (0 + 0,5 + 0,5 + 0,5 + 0,5) = 8 for 12 milestones → average = 0,667 < 0,8 and one milestone at 0 → level 3 not achieved.
N_acquired = 2. - Average of level 3 milestones = 2 / 5 = 0,4 ; × 0,99 = 0,396.
BI-TSTscore = 2 + 0,396 ≈ 2,40.
BI-TST-3.1 (at 0) is the blocking milestone: without it, level 3 remains inaccessible, regardless of everything else. Adding BI-TST-3.2 (independent expected value) gives tests that can actually fail; the three remaining milestones at 0,5 can then be completed without any additional workstream.
In what follows, the scores for the other themes are given as calculated by the workshop in the same way (illustrative values, rounded to 0,1).
Step 2 — The twelve themes#
| Theme | Code | Score | Weight | Workshop comment |
|---|---|---|---|---|
| Semantic model | MOD |
3,4 | 1 | Strict star schema, dedicated calendar; role contracts still partial |
| Data layer and ETL | ETL |
3,1 | 1 | Source SQL views, folding verified on main reports |
| Performance and data volume | PRF |
2,2 | 1 | Spot checks, no performance budget |
| Visualization and UX | VIZ |
2,6 | 1 | Shared template, user journeys not tested with users |
| DAX measures and calculations | DAX |
2,8 | 1 | Written conventions, time intelligence under control |
| RLS security and access | RLS |
2,5 | 2 | Dynamic on security table; roles lightly tested |
| Version control and industrialization | IND |
1,7 | 1 | Projects in repository, manual deployment |
| Testing and metrics reliability | TST |
2,4 | 2 | See detailed calculation above (2,40) |
| Governance, catalog, self-service | GOV |
1,5 | 1 | Owners known, no certification |
| Operations, monitoring, capacity | OPS |
1,4 | 1 | Failure alerts only |
| Accessibility and multilingual | ACC |
2,1 | 1 | Translations partially tooled, contrasts checked |
| Cost, licenses, and capacity | CST |
1,0 | 1 | Cost known at a high level |
The weight 2 on RLS and TST is decided before rating: reports are delivered to clients whose commercial data is confidential, and an incorrect metric is costly.
Step 3 — Matrix scores#
- Simple sum of the twelve scores (using 2,4 for
TST): 3,4 + 3,1 + 2,2 + 2,6 + 2,8 + 2,5 + 1,7 + 2,4 + 1,5 + 1,4 + 2,1 + 1,0 = 26,7. - Unweighted average: 26,7 / 12 = 2,23.
- Weighted average: add one more instance of
RLS(2,5) andTST(2,4): weighted sum = 26,7 + 2,5 + 2,4 = 31,6 ; sum of weights = 12 + 2 = 14 ; score = 31,6 / 14 = 2,26.
Reading with the “2 – 3” scale of the BI matrix: common practices within the team, repeatable deliveries, initial controls; quality still depends on vigilance. More useful than the average: the gap of 2,4 points between MOD (3,4) and CST (1,0), and downstream weakness (IND 1,7, OPS 1,4) despite a rather solid upstream.
Step 4 — Targets and gaps (12 months)#
Targets decided in workshop based on risk (kits delivered to about a dozen clients):
| Theme | Score | Target | Gap | Priority |
|---|---|---|---|---|
TST |
2,4 | 3,2 | 0,8 (×2) | 1 — prerequisite for IND |
IND |
1,7 | 3,0 | 1,3 | 2 — depends on TST |
OPS |
1,4 | 2,5 | 1,1 | 3 — low cost |
RLS |
2,5 | 3,0 | 0,5 (×2) | 4 — roles to test |
PRF |
2,2 | 2,5 | 0,3 | 5 |
| Others | — | maintain | 0 | — |
Selected milestones (three, no more): (a) put test DAX queries in repository with independent SQL expected values (BI-TST-3.1, 3.2), then run them for every delivery (BI-TST-4.1), (b) deploy by pipeline to a test workspace (BI-IND-3.x), (c) an operations dashboard for refreshes (BI-OPS-3.x). Expert estimate: about three months at two days per week for one person; real capacity is the team's, not the spreadsheet's.
Projection if TST (3,2), IND (3,0), OPS (2,5), and RLS (3,0) reach their targets: gains are +0,8, +1,3, +1,1, and +0,5. Simple sum = 26,7 + 3,7 = 30,4, for an average of 2,53. Weighted sum = 31,6 + 0,8 × 2 + 0,5 × 2 + 1,3 + 1,1 = 36,6, divided by 14: 2,61. Expected weighted gain: 2,61 − 2,26 = +0,35. An overall score moving by 0,3 to 0,5 per year is a realistic team pace (expert benchmark, to be adjusted).
Step 5 — What this score does not say#
- The score does not tell you whether the metric is correct today: reconciliation (milestones in
BI-TST,PD-REC) tells you that. - The team has a
CSTof 1,0 and a weight of 1: if capacity becomes a financial issue, the weight will move to 1,5 in the next cycle (publishing both calculations). - The profile is consistent: weak
TSTslowsIND, which slowsOPS. It's the upstream theme to address.
Radar reporting described in text#
🟡 Practical. A radar chart (spider diagram) shows the team's profile: one spoke per theme, a distance from center proportional to the score. It can be described without an image, making it readable in a report, a wiki, or a pipeline stage.
Reading the Atlas team radar (12 spokes, from 0 at center to 5 at edge, two blocks per score point):
MOD  ■■■■■■■  3,4   ← high point
ETL  ■■■■■■   3,1
DAX  ■■■■■■   2,8
VIZ  ■■■■■    2,6
RLS  ■■■■■    2,5   (weight 2)
TST  ■■■■■    2,4   (weight 2)
PRF  ■■■■     2,2
ACC  ■■■■     2,1
IND  ■■■      1,7
GOV  ■■■      1,5
OPS  ■■■      1,4
CST  ■■       1,0   ← low point
Reporting phrases, from general to specific:
- Shape: a “pear-shaped” polygon, bulging on the modeling side (
MOD,ETL,DAX) and narrowed on the operations side (IND,GOV,OPS,CST). Typical of a team that invested in building the product before investing in delivery and operations. - Average: 2,23 unweighted, 2,26 weighted; to be read in the “2 – 3” range.
- Links to address:
TST(upstream ofIND) thenINDthenOPS. - Commitments: three milestones, one owner each, mid-course review.
- Caution reminder: team assessment based on evidence, comparable to itself in twelve months, not comparable to another team.
For the next cycle, two series are overlaid: “cycle N” and “cycle N+1.” Describe only differences greater than 0,3 (below that, it's rating noise): “TST moves from 2,4 to 3,0 (+0,6), IND from 1,7 to 2,6 (+0,9), other themes are stable at ±0,2.”
To produce the image itself, any charting tool works (workbook, radar visual in a Power BI report): the input needed is a two-column table (theme, score). The text description remains the reference version of the report anyway.
AI Contribution#
AI is a good assistant for preparation and reporting, but a poor evaluator. It does not see your evidence, it cannot judge whether a register is active, and it can fabricate plausible evidence. The main gain is time: gathering and summarizing, comparing two cycles, drafting the plan.
| Use case | Gain /5 | Risk /5 | Maturity /5 | Prerequisites | Safeguards |
|---|---|---|---|---|---|
| Summarize evidence for a topic (pipeline logs, tickets) | 4/5 | 2/5 | 4/5 | Non-confidential data or approved tool | Each cited piece of evidence is opened in its source |
| Prepare a provisional progress status by milestone | 3/5 | 4/5 | 3/5 | Milestones and evidence provided in full | The team decides; the provisional progress status is labeled “proposal” |
| Calculate and verify scores from a grid | 3/5 | 2/5 | 4/5 | Structured grid (CSV) | Recalculation using the script in the method section |
| Write the report and progression plan | 4/5 | 2/5 | 4/5 | Scores and decisions already validated | Human review, content sign-off |
| Detect inconsistencies between dependent topics | 3/5 | 2/5 | 3/5 | Dependencies provided in the instructions | Alerts are questions, not verdicts |
Expert assessments, context: team of 5 to 10 people.
Example prompt for the report:
Here is the team's consolidated grid (topic, code, score, weight, comment).
Write a 5-sentence report: profile shape, weighted average, three links
to address while respecting upstream/downstream dependencies, commitments. Do not cite any practice
absent from the grid. Flag any inconsistency between scores of dependent topics.
Governance framework (evidence confidentiality, traceability, sign-off): Cross-Cutting Overview — AI Contribution.
See also#
- Matrices: Maturity Matrices — Principles, Anatomy, and Comparison · PI · DL · PD · BI.
- Methods: Project Management Fundamentals · Scrum in Practice · Project Management Pitfalls and Best Practices (Cross-Cutting Summary).
- Tools: Project Metrics and Reporting · Azure DevOps / TFS.
- Reporting: Power BI Reporting Project Checklists · Cross-Cutting Power BI Best Practices.
- Framework: RATING · Glossary · Bibliography and Resources.
✻ Written by Claude Sonnet 5.5
