

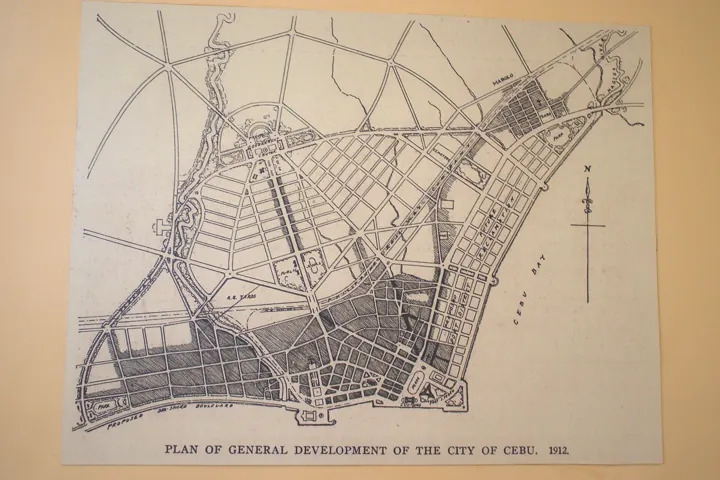
- Description
- Un plan d'aménagement général d'une ville, dessiné avant le chantier
- Source
- BJGunnaban · original page
- Licence
- CC0 Public domain
 Project Management Fundamentals
You will be able to define a project, its life cycle, its constraints (the triangle, then the “quadruple constraint”), and its roles, without academic jargon.
In brief
- You will be able to define a project, its life cycle, its constraints (the triangle, then the “quadruple constraint”), and its roles, without academic jargon.
- You will be able to distinguish predictive and adaptive steering, and choose based on the level of uncertainty (Cynefin framework).
- You will be able to reason in terms of value, risk, and stakeholders, and not only schedule and cost.
- You will understand what changes for an IT project, then for a data / BI / datamart project, where data quality is the real deliverable.
- This file is the common foundation: Scrum, predictive methods, and agile methods all build on it.
On this page
- 🟢 Novice — What is a project?
- 🟢 Novice — The life cycle of a project
- 🟢 Novice — Triangle and quadruple constraint
- 🟢 Novice — Roles
- 🟡 Practical — Predictive or adaptive
- 🟡 Practice — Value and Benefits
- 🟡 Practice — Manage Risk
- 🟡 Practice — Stakeholders and Communication
- 🟡 Practice — Specifics of IT projects
- 🟡 Practice — Data project specifics in brief
- 🔴 Expert — Uncertainty, Cynefin, and method selection
- 🔴 Expert — The triangle is a useful lie
- 🔴 Expert — Delay economics, cost of delay, and real options
- 🔴 Expert — Laws and biases that shape projects
- AI contribution
- See also
Level: 🟢→🔴
🟢 Novice — What is a project?#
A project is a temporary effort (identifiable start and end) that produces a unique result (a product, a service, a change) within given constraints. Two words matter: temporary (as opposed to operations, which are recurring) and unique (even if we have already done “something comparable,” the context, team, and data differ).
This common-sense definition matches those in standard frameworks (PMBOK from PMI, PRINCE2, ISO 21500/21502). You do not need to cite them to work: remember that a project is justified (why?), bounded (what, how far, with what?), and ended (how do we know it is finished?).
| Concept | Project | Operations (“run”) | Product (“product”) |
|---|---|---|---|
| Duration | Bounded | Continuous | Long-term, evolving |
| Result | Unique | Repeated | Evolves through increments |
| Steering | Deliver within bounds | Maintain service level | Maximize value over time |
| BI example | Migrate the datamart to a new version | Run consolidation every night | The datamart and its reports as a living product |
Many data teams face confusion: their deliverable is a product (the datamart evolves over years) but it is funded and tracked as a project (annual budget, milestones). This tension is resolved by thinking “product” (continuous backlog, Product Goal) while keeping governance milestones for funders. See Choosing Your Method and Hybridizing.
A project exists only if it has a sponsor (who pays and decides), a verifiable objective, and a team. Without an identified sponsor, it is an “initiative” that will drift; without a verifiable objective, you will never know whether it succeeded.
Succeeding: three levels of success#
A project can succeed at three independent levels:
- Management success: delivered on time, on budget, within scope. Measurable at closure.
- Product success: the deliverable works, is used, and is high quality. Measurable at delivery and after.
- Business success: expected benefits are realized (better-controlled sales, time saved, better decisions). Measurable months later.
A datamart delivered on time (success 1) that no one trusts (failure 2) produces no benefits (failure 3). The reverse also exists: a “late” project that changes the business. Mature project management measures all three.
🟢 Novice — The life cycle of a project#
Every project goes through phases, explicitly or not: we decide to do it, prepare it, execute it, put it into service, and close it. Methods differ in how these phases are sequenced, not in whether they exist.
| Phase | Dominant question | Typical deliverables | Classic mistake |
|---|---|---|---|
| Initiation / scoping | Why? For whom? How far? | Scoping note, vision, scope, stakeholders, initial risks | Scoping a solution instead of a problem |
| Planning | How, when, with whom, for how much? | Plan, milestones, budget, risk plan, organization | Planning in detail what is still unknown |
| Execution | Are we building the right thing, well? | Increments, code, models, reports, tests | Discovering gaps late |
| Monitoring / control | Where are we really? | Dashboards, reviews, decisions | Tracking activity instead of results |
| Go-live | Is it adopted, stable, supportable? | Installation kit, training, documentation, cutover | Treating deployment as a final detail |
| Closure | What did we learn? What do we hand over? | Review, lessons learned, transition to operations | Skipping closure “for lack of time” |
Monitoring is not a phase but a cross-cutting thread. Likewise, change management (training, adoption) starts at scoping, not at acceptance testing.
Product life cycle vs. project life cycle#
We must distinguish:
- the project life cycle (from idea to closure);
- the product life cycle (design → operations → evolution → retirement) — often much longer.
A project is one episode in a product’s life. Ignoring the “operations and retirement” phase during design is the classic source of debt: you deliver quickly, then pay for ten years. This “total cost of ownership” view justifies including support, monitoring, documentation, and a retirement plan for old versions from the scoping stage onward. For delivery and operations practices, see CI/CD and its counterpart CI/CD for data: foundations, datamarts, pipelines, and reports.
The three main ways to sequence phases#
| Form | Principle | When |
|---|---|---|
| Sequential (waterfall, “waterfall,” V-model) | Each phase is completed before the next | Stable requirements, low change risk, regulatory constraints |
| Iterative / incremental | We repeat small complete cycles that deliver each round | Emerging requirements, learning needed |
| Continuous flow (Kanban, DevOps) | No fixed phases: continuous intake and delivery | Maintenance, support, frequent enhancements |
Method details are in Predictive Methods (waterfall, V-model, spiral, RUP, PMBOK, PRINCE2, Merise, CMMI) and Agile and Lean Methods (Manifesto, Kanban, XP, Lean, Shape Up, DSDM, SAFe, DevOps…).
🟢 Novice — Triangle and quadruple constraint#
The iron triangle (or project management triangle, “iron triangle”) sets out three interacting constraints: scope (what is delivered), schedule (when), cost (with what resources). Changing one moves at least one other. Quality sits at the center: sacrificing it is the hidden adjustment variable.
The PMBOK later expanded this to six constraints (scope, schedule, cost, quality, resources, risk): people sometimes speak of a “quadruple constraint” by adding quality; agile offers a useful variant (see below).
What the triangle means in practice#
| If you want to… | You must accept… |
|---|---|
| Deliver faster | Reduce scope, or add resources (with diminishing returns), or cut quality |
| Reduce cost | Deliver less, later, or at lower quality |
| Keep everything fixed | High risk: the plan will only hold with luck |
“Add people to make up for delays.” Symptom: delays get worse. Cause: onboarding cost for newcomers and growth in communication channels (Brooks’ classic finding in The Mythical Man-Month: adding people to a late project makes it later, especially when the work is not very divisible). Remedy: reduce scope, protect the existing team, and reinforce only on truly parallelizable tasks.
The agile variant: fix time and cost, vary scope#
The agile triangle reverses the dogma: schedule (the timebox) and cost (team size) are fixed, and scope is allowed to vary by ordering it by value. Quality is non-negotiable (the Definition of Done is a floor). This is the deeper meaning of a sprint: the least useful 20% of scope drops first, not quality.
| Constraint | Predictive (waterfall) | Adaptive (Scrum) |
|---|---|---|
| Scope | Fixed at the start, changes via formal management | Variable, ordered by value |
| Schedule | Slips if scope is held | Fixed (timebox, sprint) |
| Cost | Slips if scope is held | Fixed (stable team) |
| Quality | Often the hidden variable | Floor is fixed (DoD) |
🟢 Novice — Roles#
Whatever the method, you find the same functions, even if methods name them differently. Distinguishing function from title avoids sterile debates (“project manager” versus “Scrum Master”).
| Function | Role | Scrum equivalent | PMBOK / PRINCE2 |
|---|---|---|---|
| Client / sponsor | Funds, arbitrates, removes blockers, carries the business case | Key stakeholders (outside the Scrum Team) | Sponsor / Executive (PRINCE2) |
| Value owner | Decides what gets built and in what order | Product Owner | Business project manager, MOA |
| Delivery lead | Organizes, coordinates, tracks, removes obstacles | Shared: Scrum Master (process), Developers (self-management) | Project manager |
| Producers | Build the deliverable | Developers | Project team |
| Users / business | Use, validate, adopt | Stakeholders, users | Users, MOA |
| Quality / architecture / security | Ensure cross-cutting standards | Competency within the Developers | Quality assurance, architect |
| PMO / governance | Portfolio consistency, reporting, method | Outside the framework | PMO, steering committee |
MOA and MOE, Francophone vocabulary#
In France, people speak of MOA (maîtrise d'ouvrage: the client, who expresses the need and validates) and MOE (maîtrise d'œuvre: who delivers). The gap between the two is a major source of misunderstandings: MOA “throws requirements over the wall,” MOE delivers, and acceptance testing reveals the gaps. Agile methods reduce this divide by integrating a business representative into the cycle (Product Owner, users in reviews), which is exactly the benefit sought. In a BI context, the data Product Owner (see Scrum Applied to Data, BI, and the Datamart) plays this bridge role.
Responsibility, authority, accountability#
Three words not to confuse. Responsibility (doing), authority (deciding), and accountability (“being answerable”) must align. A project manager accountable for outcomes but without authority over scope or team is in an untenable position. Scrum resolves this by naming a single Product Owner with authority over content (and accountable for value), and a self-managed team responsible for how to deliver. The RACI model (Responsible, Accountable, Consulted, Informed) formalizes the same idea in table form: only one “A” cell per row.
| Decision | Sponsor | PO | Dev | SM |
|---|---|---|---|---|
| Backlog order | C | A/R | C | I |
| Technical choice | I | C | A/R | I |
| Minimum quality (DoD) | I | C | A/R | C |
| Budget | A | R | I | I |
🟡 Practical — Predictive or adaptive#
Approaches sit on a continuum between two poles.
| Criterion | Predictive (plan-driven) | Adaptive (agile) |
|---|---|---|
| Assumption | Need and solution are known from the start | We learn as we move forward |
| Planning | Detailed upfront (“big design up front”) | By horizons: vision, roadmap, sprint |
| Change | Costly exception, formally controlled | Normal, welcomed, absorbed by the backlog |
| Delivery | At project end (or major milestones) | Frequent, in usable increments |
| Customer feedback | Late (acceptance testing) | Early and repeated (reviews) |
| Main risk | Delivering what was requested but not what is useful | Losing direction, scope drift, debt |
| Typical contract | Fixed price on scope | Time and materials, fixed price with variable scope |
Neither pole is “good.” A regulated building construction project is run predictively; a sales-force application with unknown usage is discovered adaptively. The real danger is a method mismatched to uncertainty: detailed planning on unknown ground, or improvising on a regulated, irreversible topic.
Hybrid approaches#
In real companies, you almost always mix: predictive framing and annual budgeting at the top, iterative execution at the bottom (sometimes called “water-scrum-fall” when it is imposed rather than chosen). The useful question is not “pure or hybrid?” but “where do I put predictability and where adaptation?”. The details are in Choosing Your Method and Hybridizing and the Comparison of Project Management Methods.
Predictive or adaptive: a 5-question test#
- Is the need stable and well understood on both sides? (yes → predictive)
- Is the technical solution known and already proven? (no → adaptive)
- Is the cost of an error discovered late prohibitive (regulatory, physical, irreversible)? (yes → predictive in those areas)
- Are users available for frequent feedback? (no → adaptive will not deliver its benefits)
- Does the funder accept value-driven steering rather than scope-driven steering? (no → plan for a predictive governance layer)
Migrating a datamart from one version to the next: the what is known (preserve the numbers), the how is uncertain (performance, dirty data). The non-regression objective and cutover schedule are set predictively; discovery of gaps is managed adaptively, slice by slice (one dimension, one fact table at a time), with acceptance testing on numbers for each slice.
🟡 Practice — Value and Benefits#
Value is what justifies the project. It is not the delivered scope: it is the benefit achieved by those who use what is delivered.
| Level | BI example |
|---|---|
| Deliverable (output) | 12 Power BI reports delivered |
| Outcome | Regional managers review the dashboard every Monday |
| Benefit (impact) | Weekly meeting prep time cut in half; faster route decisions |
A team that tracks only outputs optimizes activity; a team that tracks outcomes optimizes usefulness. This is the shift agility proposes: moving from a feature factory to an outcome-oriented team.
Business case#
A business case answers: what problem? what benefits (quantified or qualitative)? at what total cost? what risks? what is the “do nothing” alternative? It must be reviewed at milestones: a project whose justification has collapsed must be able to be stopped without shame. PRINCE2 makes this a principle (continued business justification). For budget steering and team-side value, see the matrix Budget, Value, and Benefits (VAL).
Prioritize by value#
Several tools, to be combined with critical thinking:
- MoSCoW (Must / Should / Could / Won't): simple, but everything becomes “Must” without firm trade-offs.
- Cost of Delay and WSJF (Weighted Shortest Job First) = cost of delay ÷ duration: handle first what loses the most value per unit of waiting time.
- Value × confidence ÷ effort (ICE/RICE variants): useful, but initial numbers are estimates; do not give them a precision they do not have.
- Kano: distinguishes basic, expected, and delighting needs.
- Story mapping: view the user journey to decide “the smallest increment that makes sense.”
For each initiative, write a verifiable value hypothesis (“we believe X will move metric Y from A to B by T”) and plan how it will be measured. Without that, value remains an opinion.
Vanity metrics (number of reports delivered, pages, visits). Symptom: all green lights and yet nobody uses it. Cause: measuring what is easy. Remedy: track adoption (active users, usage frequency), trust in the numbers (acceptance testing variances), and one business metric.
🟡 Practice — Manage Risk#
A risk is an uncertain event that, if it occurs, has an effect (positive or negative) on objectives. A risk is not an issue: an issue is already here (you address it), a risk is probable (you anticipate it). Confusing the two creates “risk registers” that are actually issue lists.
The four classic responses#
| Response | Principle | Data example |
|---|---|---|
| Avoid | Remove the cause | Drop an unreliable data source |
| Mitigate | Reduce probability or impact | Exploration spike, prototype, early acceptance testing |
| Transfer | Have a third party carry it | Contract, insurance, managed hosting |
| Accept | Own it (with or without contingency) | Known debt on a rarely used dimension |
Criticality#
Criticality = probability × impact, on simple scales (1 to 5). Prioritize by descending criticality; do not exceed about fifteen actively tracked risks. A risk is alive: name an owner, a review date, a trigger (warning signal), and an action.
| ID | Risk | P | I | Criticality | Response | Owner |
|---|---|---|---|---|---|---|
| R1 | The SFA source changes its schema without notice | 4 | 4 | 16 | Mitigate: interface contract, schema test at each load | Data lead |
| R2 | Users do not trust the numbers | 3 | 5 | 15 | Mitigate: acceptance testing on numbers, reconciliation with the source | PO |
| R3 | Departure of the only expert in one area | 2 | 5 | 10 | Mitigate: documentation, pairing | Manager |
| R4 | Data volume higher than expected | 3 | 3 | 9 | Accept + monitor | Architect |
Agility is risk management#
Short iteration is the best response to design risk (building the wrong product): you discover it in two weeks rather than two years. By itself, it does not address architecture, security, or compliance risk, which require explicit guardrails (spikes, reviews, constraints in the Definition of Done). The risk chapter of the matrices is in Risk Management (RSK).
Tackle risk first, not ease: in the first sprints, handle the riskiest vertical slice (the most doubtful source, the most ambiguous metric, the performance constraint) rather than the simplest screen. Remaining risk then decreases faster than visible progress.
🟡 Practice — Stakeholders and Communication#
A stakeholder is any person or entity that can affect the project or be affected by it. Identify them, understand their expectations, decide what to do with them.
The power × interest grid (Mendelow) is the most common:
| Low interest | High interest | |
|---|---|---|
| High power | Keep satisfied (IT, security, finance) | Manage closely (sponsor, sales leadership) |
| Low power | Monitor | Keep informed (end users, support) |
On a datamart fed by a field SFA: the sales director is “manage closely”; the team administering the SFA is also “manage closely” (it is the source, it drives everything) but is often forgotten in grids; IT security is “keep satisfied”; field sales reps are “keep informed” and yet they are users of the source application (their data entry quality drives your numbers).
Communicate: minimal plan#
| Audience | Message | Frequency | Channel |
|---|---|---|---|
| Sponsor | Value delivered, risks, decisions needed | Monthly or by milestone | Short review |
| Business / PO | Progress, trade-offs, acceptance testing | Each sprint | Review, shared backlog |
| Team | Priorities, blockers | Daily | Short sync |
| Users | What's new, training, release notes | At each release | Release notes, training |
| Operations / support | Changes, impacts, procedures | Before each production deployment | Kit, installation notes |
The goal is transparency: the earlier a gap (delay, quality concern) is reported, the less it costs. A project that is “all green” until the last month almost always hides unreported information (the “watermelon syndrome”: green outside, red inside). Useful indicators are presented in Project Metrics and Reporting. The corresponding matrix theme is Stakeholders and Communication (PAR).
🟡 Practice — Specifics of IT projects#
An IT project has traits that set it apart from a construction or manufacturing project: it produces an intangible object, copyable at zero cost, continuously modifiable, whose complexity is invisible (code cannot be seen, it is read).
| Trait | Consequence for management |
|---|---|
| Emerging requirements: the client discovers their need by seeing the software | Iterate, show early, accept change |
| Invisibility of progress | “90% done” is an illusion; measure in functional, tested increments |
| Productivity variability (from 1x to several times depending on people and contexts) | Person-day estimates are fragile; stabilize teams |
| Technical debt: shortcuts are paid back with interest | Make quality non-negotiable (DoD), repay continuously |
| Integration: the later you integrate, the harder it gets | Continuous integration, frequent deliveries |
| External dependencies (APIs, vendors, other teams) | Identify them early, treat them as major risks |
| Maintenance cost higher than creation cost (common order of magnitude, not universal) | Design for operations |
The historical observation#
Survey reports on project failures (such as the Standish Group's CHAOS Report) strongly shaped the debate, but their methodology is contested. They should be cited cautiously: the key idea is that large projects planned all at once with fixed scope fail more often than small projects delivered in stages, which is supported by other sources (including the experience behind the Agile Manifesto). So we should avoid relying on a precise percentage.
Ingredients of modern IT maturity#
- Small batches: smaller batch, less risk, more feedback (Lean principle).
- Automation: repeatable builds, tests, deployment.
- Fast feedback: at every level (tests, code review, sprint review, monitoring).
- End-to-end ownership: “you build it, you run it” (DevOps vision).
Research by the DORA team (Accelerate, and the annual “State of DevOps” reports) showed that deployment frequency, lead time for changes, change failure rate, and time to restore service are indicators correlated with organizational performance. These are the “four key metrics”; see CI/CD for how to use them.
🟡 Practice — Data project specifics in brief#
A data project (datamart, warehouse, reporting) shares everything above, but the deliverable is a set of numbers that must be trustworthy. Details are in Scrum and data and Methods Specific to Data Projects. In short:
| Specificity | Why it changes project management |
|---|---|
| Quality is value | A wrong dashboard is worse than no dashboard; acceptance testing focuses on numbers, not screens |
| Dependency on source systems | You control neither the schema, nor quality, nor source schedule |
| Data = state, not just code | A code deployment is not enough: you also need to reload, migrate, historize, replay |
| Volume and performance | A model that works at 1 million rows can collapse at 1 billion |
| Historization and irreversibility | Overwriting historical data may be impossible to undo |
| Security, GDPR, role-based access | Compliance determines delivery |
| Business semantics | The definition of a KPI is a governance topic before it is a technical one |
| Discovery | You do not always know whether the data exists and whether it is usable before looking |
| Multilingualism and versions | For a product delivered to multiple customers and versions, compatibility matters |
Delivering a report quickly on unreconciled data. Symptom: the user compares it with their Excel, finds a gap, and permanently loses trust. Cause: acceptance testing was done on appearance. Remedy: numeric reconciliation against a reference source, signed off by the business, before release (see Acceptance testing and business validation and Data Quality).
🔴 Expert — Uncertainty, Cynefin, and method selection#
The Cynefin framework (Dave Snowden) classifies situations by the relationship between cause and effect, and prescribes an appropriate way to act. It is valuable for selecting a method because it reminds us that there is no universal method: there are problem types.
| Domain | Cause-effect relationship | Stance | Project example |
|---|---|---|---|
| Clear (obvious) | Obvious, known by everyone | Sense → categorize → respond (good practices) | Creating a user account, deploying a proven kit |
| Complicated | Exists but requires expertise | Sense → analyze → respond (expert good practices) | Query optimization, star-schema design |
| Complex | Visible only in hindsight, emergent | Probe → sense → respond (emergent practices) | Discovering what sales teams will actually use |
| Chaotic | No discernible relationship | Act → sense → respond | Major production incident |
| Confused (disorder) | You do not know which domain you are in | Break down the situation | Poorly framed project start |
Reading for project management:
- Clear / complicated: predictive methods and detailed planning work; expertise is enough, you can estimate, standardize, automate.
- Complex: agility (experiment, inspect, adapt) is the right tool — this is Scrum's territory, whose foundation is precisely empiricism.
- Chaotic: stabilize first (crisis management), then analyze.
A single project contains all four domains in different places. Scrum does not eliminate the complicated (expertise is still required), it frames the complex.
The “cone of uncertainty”#
Boehm illustrated (and McConnell popularized) the idea that uncertainty on cost and duration is very wide at the very beginning of a project and narrows as you move forward. The exact shape and numerical factors are debated and context-dependent; the robust message is: an estimate made before exploration is a wide range, not a commitment. Committing to a single number during framing is a governance act, not a measurement.
Stacey and the complexity zone#
The Stacey matrix combines degree of agreement on the need and certainty about the technical approach. When neither is established, you are in “complexity,” and prescriptive methods fail. This framing justifies investing in discovery (workshops, prototypes, spikes) before committing to scope.
Break down the project by uncertainty zones, not by functions. Clear or complicated zones get a plan and an estimate; complex zones get a discovery budget (timebox) and a decision criterion: “continue / pivot / stop.”
🔴 Expert — The triangle is a useful lie#
The iron triangle is an excellent teaching tool and a poor predictive model:
- Scope is not homogeneous. Twenty requirements do not have the same value: in the vast majority of cases, a small fraction carries most of the value (common order of magnitude, not a law). Talking about “scope” as a block hides the essential trade-off.
- Quality is not a continuous variable. There is a floor below which no value is delivered (wrong numbers, failed security). And internal quality (maintainability) influences future lead time: sacrificing it borrows from the future at a high rate.
- Schedule and cost are not independent of scope through a linear law: the relationship is non-linear (Brooks's law, coordination costs, Parkinson's law).
- The triangle ignores value and risk, even though they are what justify the project.
The alternative is a “diamond” or a richer view: value, risk, quality, duration, cost. In an agile framework, you steer delivered value per unit of time and residual risk, while schedule and cost are fixed by design.
The three laws that defuse illusions#
| Law | Statement | Consequence |
|---|---|---|
| Parkinson | Work expands to fill the available time | Hidden per-task margins are lost; protect the overall margin |
| Student syndrome | People start at the last moment | Per-task buffers are wasted |
| Hofstadter | It always takes longer than expected, even when taking Hofstadter's law into account | Optimism is systemic; use historical references |
The critical chain method (Goldratt) draws a consequence from this: individual margins are removed and pooled into a project buffer, whose consumption is monitored. It is presented in Predictive Methods (waterfall, V-model, spiral, RUP, PMBOK, PRINCE2, Merise, CMMI).
🔴 Expert — Delay economics, cost of delay, and real options#
Cost of Delay#
Don Reinertsen (The Principles of Product Development Flow) argued that the most overlooked economic factor in development is cost of delay: value lost per unit of delay time in a delivery. From this he derives WSJF:
Three cost-of-delay profiles illustrate the diversity:
| Profile | Shape | Example |
|---|---|---|
| Linear (“standard”) | Constant loss per week | Recurring productivity gain |
| Fixed deadline | No loss, then a sudden loss at a specific date | Regulatory requirement, annual commercial campaign |
| Urgency (“expedite”) | High loss from day one, then tapering off | Temporary competitive advantage |
Two requests of the same size: A saves 2 h/week for 100 people (linear); B avoids a compliance failure due in 6 weeks (fixed deadline). Before the deadline, B can wait at no cost… until the date gets close: then its cost of delay becomes huge. A simple ranking by “value” or “effort” misses this dynamic; cost of delay by profile reveals it.
Delay decisions, buy options#
The real options approach applies financial logic to project decisions: an irreversible choice made early is paid for through lost flexibility; postponing until the last responsible moment (last responsible moment, an expression popularized by the Lean/agile community) preserves options at lower cost. This is not indecision: it's deciding when information is best, before the cost of waiting exceeds the cost of being wrong.
Concretely for data: choosing a fact table's granularity or a dimension's surrogate key is costly to reverse (all consumers depend on it) — do it early but with full awareness. Choosing a report's visual is inexpensive to change — you can delay and iterate.
Little's Law and flow#
Little's Law (queueing theory) links the quantities of a system in steady state:
Direct consequence: to shorten lead time without changing throughput, you must reduce work in progress. Starting more things slows each one down. This is the mathematical foundation for Kanban WIP limits and Scrum's preference for limited-scope sprints. See Agile and Lean Methods (Manifesto, Kanban, XP, Lean, Shape Up, DSDM, SAFe, DevOps…).
A team of 4 people carries 20 requests in progress and completes 5 per week on average. Average lead time = 20 ÷ 5 = 4 weeks. Bringing WIP down to 10 without changing throughput gives a 2-week lead time; each request is delivered twice as fast, and value arrives sooner. Assumption: steady state, illustrative order of magnitude.
🔴 Expert — Laws and biases that shape projects#
| Law / bias | Statement | Remedy |
|---|---|---|
| Conway's Law | Systems reflect the communication structure of the organization that designs them | Align teams and architecture (“reverse Conway maneuver”) |
| Goodhart's Law | When a measure becomes a target, it ceases to be a good measure | Multiple indicators, never just one; no individual targets on team metrics |
| Planning fallacy | Durations and costs are systematically underestimated (Kahneman & Tversky) | “Outside view”: rely on comparable projects and historical data |
| Sunk costs (sunk cost) | We continue because we've already invested | Decide based on future costs and benefits |
| Confirmation bias | We look for what validates the hypothesis | Actively seek refutation, contradictory acceptance testing |
| Lehman's Law / entropy | Software in use either evolves or degrades | Budget for evolution and refactoring |
| Dunning-Kruger effect (careful use) | Overestimating one's competence at the start of learning | Peer reviews, pair programming |
| Groupthink | Consensus suppresses doubts | Devil's advocate role, safe retrospectives |
Goodhart's Law applied to velocity or coverage rate. Symptom: velocity rises, delivered value does not. Cause: the team inflates estimates to hit a velocity target. Remedy: never use velocity as a target or compare it across teams (see Scrum in Practice).
Psychological safety#
Amy Edmondson's work on psychological safety (the belief that people can speak up, report an error, or express doubt without being punished) and Google's “Aristotle” project are often cited to show that the quality of team interactions matters more than team composition. In practice: a project manager who punishes bad news gets green status reports until collapse. Team culture is measured in the matrix Team and Collaboration (EQU).
AI contribution#
At this “fundamentals” level, AI helps structure and challenge, not decide.
| Use case | Gain | Risk | Maturity | Prerequisites | Guardrails |
|---|---|---|---|---|---|
| Draft an initial scoping note from raw notes | 4/5 | 3/5 | 4/5 | Meeting notes, provided context | Review by sponsor; do not invent numeric data |
| Generate an initial risk register (by analogy) | 3/5 | 3/5 | 4/5 | Project description | Starter list, to be filtered; human owners |
| Analyze stakeholders, propose a communication plan | 3/5 | 2/5 | 4/5 | List of stakeholders | Contextualize; do not share personal data |
| “Devil's advocate” on a business case | 4/5 | 2/5 | 4/5 | Written business case | Objections are hypotheses to verify |
| Estimate timeline and costs for an unknown project | 2/5 | 5/5 | 2/5 | Team history | Never use as a commitment; AI does not have your history |
Example prompts:
- “Here is the context of our project [anonymized summary]. List ten risks we did not mention, ranked by probability and impact, and for each one an early warning signal.”
- “Review this business case like a skeptical CFO: which assumptions are unsupported?”
What AI does not replace: judgment about value, trade-offs among stakeholders, accountability for the decision, and knowledge of your history and culture. It must not receive unauthorized confidential data. Watch out for hallucinations (plausible but false facts, references, or numbers) and hidden debt (plans produced without team ownership). See AI for Project Management (General Then Data).
See also#
- Logical next step: Scrum, the framework (Scrum Guide 2020) then Scrum in Practice.
- Other approaches: Predictive Methods (waterfall, V-model, spiral, RUP, PMBOK, PRINCE2, Merise, CMMI), Agile and Lean, Comparison of Project Management Methods, Choosing Your Method and Hybridizing.
- Cross-functional pitfalls: Pitfalls and Good Practices in Project Management (Cross-Functional Synthesis).
- Measure your practice: Maturity Matrix — IT Project Management (PI), Scoping and Vision (CAD), Planning and Estimation (PLA).
- Terms: Glossary; how to read ratings: Rating: Reading Ratings, Scores, and the Legend.
- Tools: Planning, Azure DevOps / TFS.
✻ Written by Claude Sonnet 5.5
