

- Description
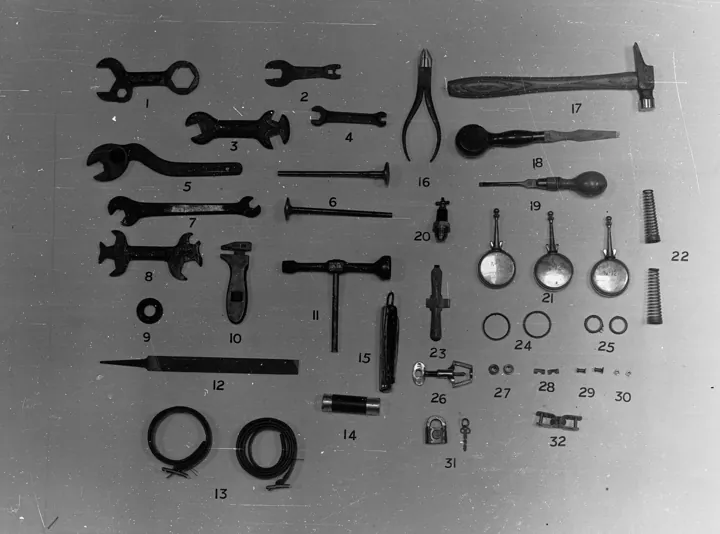
- Une collection d'outils numérotés, disposés côte à côte pour comparaison
- Source
- State Government Photographer · original page
- Licence
- CC0 Public domain
 Comparison of project management methods
You have two /5 rating grids (general software project, then data/BI project) across nine aspects, for twelve approaches: waterfall, V-model, spiral/RUP, PRINCE2/PMBOK, DSDM, Scrum…
In short
- You have two /5 rating grids (general software project, then data/BI project) across nine aspects, for twelve approaches: waterfall, V-model, spiral/RUP, PRINCE2/PMBOK, DSDM, Scrum, Kanban, Scrumban, XP, Lean startup, Shape Up, SAFe.
- Each grid is a table heatmap (one colored square per rating) to spot weaknesses and strengths at a glance.
- You will learn to read these ratings with caution: they are expert, contextual assessments that collapse if the context changes.
- You will see how to weight by project profile, and which contexts tip the decision.
- You are not looking for “the best method” but the least bad one for your context: the decision is made in Choosing Your Method and Hybridizing.
On this page
- 1. Warning: what these ratings are (and are not)
- 2. The nine defined aspects
- 3. Grid 1 — general software project
- 4. Grid 2 — data / BI project
- 5. What changes between the two grids
- 6. Weighting by project profile
- 7. Critical reading of the ratings
- 8. Contexts That Shift the Balance
- 9. AI Contribution
- 10. See also
Level: 🟢→🔴
1. Warning: what these ratings are (and are not)#
🟢 Novice — A 4/5 rating does not mean “the method is 80% good.” It means: in the stated context, on this
aspect, an experienced practitioner expects a result clearly above the average of the methods compared. The principles of
rating (scale, context, Goodhart's law) are described in RATING.
Shared context for the ratings: team of 4 to 12 people, project of 6 to 18 months, mid-sized organization, competent practitioners (a poorly applied method has no rating: see Pitfalls and good practices in project management (cross-functional summary)).
Reading a rating table as a ranking. There is no winner: a method rated 5/5 in adaptation to change may be 2/5 in contractual visibility; if your contract requires visibility, the “5-rated” method is the wrong answer.
Before looking at the ratings, write down your two or three non-negotiable constraints (for example: fixed-price contract, regulatory deliverable, team of three people). They eliminate entire rows; the ratings are then only used to break ties among what remains.
2. The nine defined aspects#
🟡 Practical — The ratings are consistent with the other guides: same vocabulary as Predictive Methods (waterfall, V-model, spiral, RUP, PMBOK, PRINCE2, Merise, CMMI) and Agile and Lean Methods (Manifesto, Kanban, XP, Lean, Shape Up, DSDM, SAFe, DevOps…).
| # | Aspect | Question asked | 5/5 means |
|---|---|---|---|
| 1 | Predictability | can you make credible commitments on date, cost, scope? | reliable commitments in advance |
| 2 | Adaptation to change | can requirements change during the project without breaking the plan? | change is welcomed at low cost |
| 3 | Risk control | are technical and business risks addressed early? | major risks removed early by design |
| 4 | Lightweightness (overhead) | how much time goes to the method rather than the product? | very few rituals and documents |
| 5 | Context fit | does the method fit the nature of the project (software product / data)? | designed for this case |
| 6 | Ease of adoption | how much training, how much cultural change? | startup in a few days |
| 7 | Scaling | does it hold with multiple teams, multiple sites? | equipped for coordination |
| 8 | Visibility / governance | can a steering committee, an auditor, a client see the real status? | formalized, auditable governance |
| 9 | Deliverable quality | is the delivered product robust, tested, maintainable? | built-in quality practices |
Note on aspect 5: in grid 1 it measures fit for a software product; in grid 2, fit for a data/BI project (source quality, model, acceptance testing on numbers, historization, kit-based delivery).
3. Grid 1 — general software project#
Heatmap legend: 🟥 1 · 🟧 2 · 🟨 3 · 🟩 4 · 🟦 5. Columns: Predictability · Adaptation · Risk · Lightweightness · Fit for software · Adoption · Scale · Governance · Quality.
| Method | Pred | Adap | Risk | Light | Fit | Adop | Scal | Gov | Qual | Avg. (unweighted) |
|---|---|---|---|---|---|---|---|---|---|---|
| Waterfall | 🟨3 | 🟥1 | 🟥1 | 🟨3 | 🟧2 | 🟩4 | 🟨3 | 🟩4 | 🟧2 | 2,6 |
| V-model | 🟩4 | 🟥1 | 🟨3 | 🟧2 | 🟨3 | 🟩4 | 🟩4 | 🟩4 | 🟨3 | 3,1 |
| Spiral / RUP | 🟨3 | 🟨3 | 🟦5 | 🟧2 | 🟨3 | 🟧2 | 🟩4 | 🟩4 | 🟩4 | 3,3 |
| PRINCE2 / PMBOK | 🟩4 | 🟧2 | 🟩4 | 🟧2 | 🟨3 | 🟨3 | 🟦5 | 🟦5 | 🟨3 | 3,4 |
| DSDM | 🟩4 | 🟩4 | 🟨3 | 🟧2 | 🟩4 | 🟧2 | 🟨3 | 🟩4 | 🟩4 | 3,3 |
| Scrum | 🟨3 | 🟦5 | 🟨3 | 🟩4 | 🟦5 | 🟩4 | 🟨3 | 🟨3 | 🟩4 | 3,8 |
| Kanban | 🟨3 | 🟩4 | 🟧2 | 🟦5 | 🟩4 | 🟦5 | 🟨3 | 🟨3 | 🟨3 | 3,6 |
| Scrumban | 🟨3 | 🟩4 | 🟨3 | 🟩4 | 🟩4 | 🟩4 | 🟧2 | 🟨3 | 🟨3 | 3,3 |
| XP | 🟨3 | 🟦5 | 🟩4 | 🟨3 | 🟩4 | 🟧2 | 🟧2 | 🟧2 | 🟦5 | 3,3 |
| Lean startup | 🟥1 | 🟦5 | 🟩4 | 🟩4 | 🟩4 | 🟨3 | 🟧2 | 🟧2 | 🟨3 | 3,1 |
| Shape Up | 🟩4 | 🟩4 | 🟩4 | 🟩4 | 🟩4 | 🟨3 | 🟧2 | 🟨3 | 🟩4 | 3,6 |
| SAFe | 🟩4 | 🟨3 | 🟩4 | 🟥1 | 🟩4 | 🟧2 | 🟦5 | 🟦5 | 🟨3 | 3,4 |
Justification for the most discriminating ratings (one sentence each):
- Waterfall, adaptation 1/5: real feedback arrives only at the end of the project, so any late change is expensive.
- V-model, quality 3/5: verification is planned early, but executed late and in one block.
- Spiral, risk 5/5: the cycle is entirely driven by risk reduction, at the cost of difficult adoption 2/5.
- PRINCE2, governance 5/5: tolerances, stages, and committee provide a complete audit trail; lightweightness 2/5 as a tradeoff.
- Scrum, fit 5/5: designed for a software product with evolving needs; predictability 3/5 because forecasting is probabilistic (velocity), not committed to a long-term scope.
- Kanban, lightweightness 5/5, risk 2/5: no ceremonies, but no built-in risk treatment mechanism.
- XP, quality 5/5 but scale 2/5: technical practices are the most demanding, multi-team coordination is missing.
- Lean startup, predictability 1/5: by design, you do not commit to an outcome, you commit to experiments.
- Shape Up, scale 2/5: designed for one product and small autonomous teams.
- SAFe, lightweightness 1/5: large-scale coordination has a high organizational cost; scale 5/5 in return.
4. Grid 2 — data / BI project#
Additional context: a SQL Server datamart fed by operational sources (field sales force application, for example), Power BI reports, acceptance testing on figures by the business, delivery in versioned installation kits. Aspect 5 here measures fit for a data/BI project (source profiling, historization, replay, migrations).
| Method | Pred | Adapt | Risk | Lean | Data fit | Adopt | Scale | Gov | Qual | Avg. (unweighted) |
|---|---|---|---|---|---|---|---|---|---|---|
| Waterfall | 🟧2 | 🟥1 | 🟥1 | 🟨3 | 🟧2 | 🟩4 | 🟨3 | 🟩4 | 🟧2 | 2,4 |
| V-cycle | 🟨3 | 🟥1 | 🟨3 | 🟧2 | 🟨3 | 🟩4 | 🟩4 | 🟩4 | 🟨3 | 3,0 |
| Spiral / RUP | 🟨3 | 🟨3 | 🟦5 | 🟧2 | 🟨3 | 🟧2 | 🟨3 | 🟩4 | 🟨3 | 3,1 |
| PRINCE2 / PMBOK | 🟩4 | 🟧2 | 🟩4 | 🟧2 | 🟨3 | 🟨3 | 🟩4 | 🟦5 | 🟨3 | 3,3 |
| DSDM | 🟩4 | 🟩4 | 🟨3 | 🟧2 | 🟩4 | 🟧2 | 🟨3 | 🟩4 | 🟩4 | 3,3 |
| Scrum | 🟨3 | 🟩4 | 🟨3 | 🟩4 | 🟩4 | 🟩4 | 🟨3 | 🟨3 | 🟨3 | 3,4 |
| Kanban | 🟨3 | 🟩4 | 🟨3 | 🟦5 | 🟦5 | 🟦5 | 🟨3 | 🟨3 | 🟨3 | 3,8 |
| Scrumban | 🟨3 | 🟩4 | 🟨3 | 🟩4 | 🟦5 | 🟩4 | 🟧2 | 🟨3 | 🟨3 | 3,4 |
| XP | 🟨3 | 🟩4 | 🟩4 | 🟧2 | 🟨3 | 🟧2 | 🟧2 | 🟧2 | 🟩4 | 2,9 |
| Lean startup | 🟥1 | 🟦5 | 🟩4 | 🟩4 | 🟩4 | 🟨3 | 🟧2 | 🟧2 | 🟨3 | 3,1 |
| Shape Up | 🟨3 | 🟩4 | 🟩4 | 🟩4 | 🟨3 | 🟧2 | 🟧2 | 🟨3 | 🟨3 | 3,1 |
| SAFe | 🟨3 | 🟨3 | 🟩4 | 🟥1 | 🟧2 | 🟧2 | 🟩4 | 🟦5 | 🟨3 | 3,0 |
Justification for the gaps versus grid 1 (what changes when it's data):
- Kanban rises (fit 5/5): data workload is made up of requests with heterogeneous size and urgency (incident, enhancement, figure correction); flow and classes of service are a natural fit.
- Scrum drops (fit 4/5, predictability 3/5): the “potentially shippable” increment is harder to define when data depends on heavy environments and business acceptance testing; sprint slicing works poorly when a source imposes its own schedule. Details in Scrum and data.
- XP drops (leanness 2/5, fit 3/5): testing, continuous integration, and pairing practices exist but require data testing tooling that is less mature than application code tooling.
- Waterfall / V drop in predictability: the plan assumes the sources are known; profiling often reveals surprises. But for a like-for-like migration, V goes back up (predictability 4/5 in this specific case).
- SAFe drops (fit 2/5): few data projects reach the size where a release train is justified.
- Lean startup stays high in adaptability: report prototyping and exploratory analysis are true MVPs.
The same “sales reporting redesign” project broken down into three work packages: (A) migration of the existing model to a new database version, like-for-like → V-cycle + PRINCE2-like governance (the plan is solid, acceptance testing is a before/after comparison); (B) new indicators requested by sales leadership → Scrum or Scrumban with a numbers-based review every 15 days; (C) daily handling of load anomalies and access requests → Kanban. No single method fits all three work packages, hence the hybridization in the next article.
5. What changes between the two grids#
🟡 Practical — The eight traits of data projects that shift ratings:
| Data trait | Effect on methods |
|---|---|
| Source quality unknown at the start | penalizes any plan locked in early; favors discovery loops (spiral, spike, profiling) |
| Acceptance testing on figures by a scarcely available business team | bottleneck for every framework; favors flow and continuous acceptance testing rather than final acceptance testing |
| Historization and replay (idempotence, SCD) | early decisions that are costly to change; calls for some upfront design |
| Data volume | test environments hard to reproduce; slows feedback loops |
| Dependencies on other teams' data | data contracts; favors frameworks with coordination (Nexus, Scrum of Scrums) |
| Version migrations | known scope, high predictability; favors V |
| Regulation / GDPR | traceability, governance, rights; favors formalized governance |
| Delivery in versioned kits | constrained delivery cadence; rewards release discipline |
Details and countermeasures in Methods Specific to Data Projects and in the matrices Maturity Matrix — Data Project Management (PD) and Maturity Matrix — Development of a BI Tool / Application.
6. Weighting by project profile#
🟡 Practical — The unweighted average assumes the nine aspects all matter equally: that's false in every real case. You choose weights (0 to 3) based on context. Two profiles, applied to grid 2 (data) — the weights are illustrative choices, not truths:
| Aspect | Profile A: regulatory reporting, fixed scope | Profile B: product exploration, uncertain need |
|---|---|---|
| Predictability | 3 | 1 |
| Adaptation | 1 | 3 |
| Risk | 2 | 2 |
| Leanness | 1 | 2 |
| Data fit | 2 | 2 |
| Adoption | 1 | 1 |
| Scale | 1 | 1 |
| Governance | 3 | 1 |
| Quality | 2 | 2 |
| Sum of weights | 16 | 15 |
Results (weighted score = Σ weight × score / Σ weights), for five approaches:
| Approach | Profile A (regulatory) | Profile B (exploration) |
|---|---|---|
| V-cycle | 3,1 | 2,7 |
| PRINCE2 / PMBOK | 3,6 | 3,1 |
| Scrum | 3,3 | 3,5 |
| Kanban | 3,6 | 3,9 |
| Lean startup | 2,8 | 3,5 |
Reading: profile A brings V and PRINCE2 up; profile B raises Kanban and Lean startup. But note two warning signals.
Kanban “wins” (or ties for first) in both profiles. This is not proof that it's the best method; it's the sign that the grid doesn't include any criterion that penalizes it: contracting, commitment to a scope, project planning. A nine-criterion model is always incomplete. Remedy: add the missing criteria from your context (fixed-price contract? multi-year capacity plan?) before deciding.
Do the exercise with your team: each person sets weights individually, then compare. The weight gaps reveal the real disagreements on priorities (contractual security vs. speed), much more than the numeric result.
7. Critical reading of the ratings#
🔴 Expert — Five reasons not to treat ratings as measurements:
- No single empirical measurement. Comparative studies between methods are rare, heterogeneous, and context-sensitive; we don't have robust data that would allow us to quantify these ratings. They are expert judgments with supporting arguments, so they are debatable and revisable.
- Within-method variance exceeds between-method variance. Two teams doing “Scrum” differ more from each other than Scrum differs from well-executed Kanban. Quality of implementation (coaching, management commitment, technical discipline) matters more than the method name.
- Methods are often mixed. Almost no real project is “pure”: see the next article.
- Halo effect of criteria. “Leanness” and “adoption” are correlated in evaluators' minds; the average counts them twice. Any aggregate is debatable.
- The organization is the hidden variable. A “scaling” score says nothing about management, architecture, or contracts, which determine the outcome.
Use the grid as a conversation support and not as an oracle: it structures the team discussion, forces criteria to be made explicit, and encourages listening to disagreements.
Useful correlations to remember (qualitative):
- Predictability and adaptation are in tension: the more you lock things down, the less you adapt. Methods that score high on both (DSDM, Shape Up) do so by fixing timeline and budget while varying scope.
- Leanness and governance are in tension: strong governance requires artifacts.
- Deliverable quality depends more on engineering practices (tests, review, continuous integration) than on the planning method: XP enforces them explicitly, but you can add them to any method.
- Scaling always costs leanness: each coordination layer adds meetings. The best way to scale is reducing dependencies.
8. Contexts That Shift the Balance#
🟡 Practical — A single context change can overturn the choice. Here are the most common shifts to revisit at each project milestone:
| If this changes… | …then the method shifts toward |
|---|---|
| The contract becomes a fixed-price scope-based contract | more predictive (V, PRINCE2) or agile with a negotiable scope (DSDM, MoSCoW) |
| A regulation requires evidence and traceability | formal governance + traced verification/validation; agile with an evidence file |
| Uncertainty about the need goes from low to high | iterative (Scrum, Lean startup, spiral) |
| Migration with no functional change replaces enhancement | V-model with comparative acceptance testing |
| The workload becomes support (> 50% unplanned) | Kanban / Scrumban |
| The number of teams goes from 1 to 4+ with a shared product | Nexus / LeSS / Scrum of Scrums / SAFe depending on governance |
| Business availability collapses | asynchronous acceptance testing, flow; alert: no framework can withstand that |
| Technical maturity (tests, CI) is low | start with XP/DevOps before multiplying ceremonies |
| The team becomes distributed/outsourced | more documentation, interface contracts, explicit milestones |
| The product enters run mode | Kanban; stop sprints that no longer deliver new value |
Trade-offs are laid out step by step in Choosing Your Method and Hybridizing.
Choosing once and for all. Symptom: the launch method is still applied three years later, even though the product is in run mode and the team has doubled. Cause: treating the method like a religion, not a tool. Remedy: a method review at every major milestone (phase change, team size change, contract change); make it a standing item on a “meta” retrospective agenda.
9. AI Contribution#
🤖 AI — Useful for exploring scenarios and clarifying criteria, risky for deciding.
| Use case | Gain | Risk | Maturity | Prerequisites | Guardrails |
|---|---|---|---|---|---|
| Helping formalize criteria and weights | 3/5 | 2/5 | 4/5 | project context described | discuss as a team; AI has no hidden context |
| Simulating weightings / sensitivity analysis | 4/5 | 2/5 | 4/5 | table-format grid | check calculations by hand on 2 rows |
| Drafting a decision rationale for a committee | 3/5 | 3/5 | 4/5 | decision made beforehand | AI formats, it does not justify |
| Recommending “the” method | 1/5 | 5/5 | 2/5 | — | avoid: plausible response with no grounding |
Prompt example: “Here is my grid (table) and my constraints (fixed-price contract, 6 people, biweekly business acceptance testing). Vary the weights by ±1 on each aspect and tell me which approaches change rank.”
What AI does not replace: knowledge of people, the actual contract, and your organization’s risk tolerance. See also AI in Service of Project Management (General Then Data).
10. See also#
- Before: Predictive Methods (waterfall, V-model, spiral, RUP, PMBOK, PRINCE2, Merise, CMMI) · Agile and Lean Methods (Manifesto, Kanban, XP, Lean, Shape Up, DSDM, SAFe, DevOps…) · Methods Specific to Data Projects.
- After: Choosing Your Method and Hybridizing · CI/CD · Pitfalls and good practices in project management (cross-functional summary).
- Framework: Scrum · Scrum and data · Fundamentals.
- Tools: comparison of tools · planning tools.
- Maturity: Governance and Steering (GOU) · Continuous Improvement and Learning (AMC) · Delivery and Production Release (LIV).
- Glossary · Rating.
✻ Written by Claude Sonnet 5.5
